|
|
|

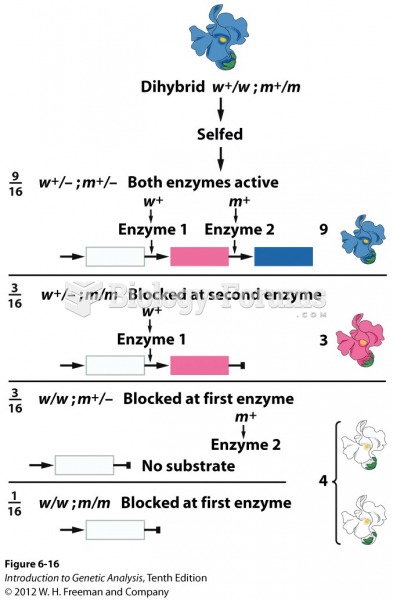 A model for recessive epistasis
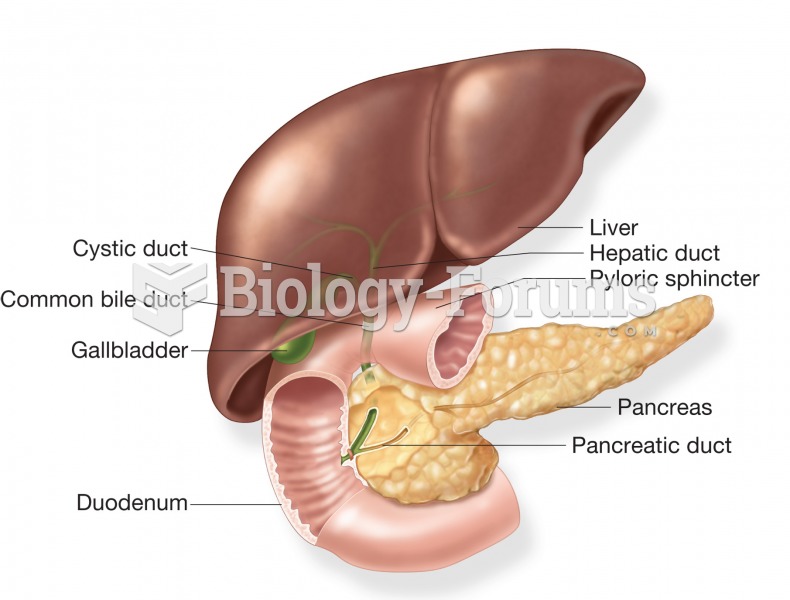 The accessory organs of the digestive system: the liver, gallbladder, and pancreas. Image shows the
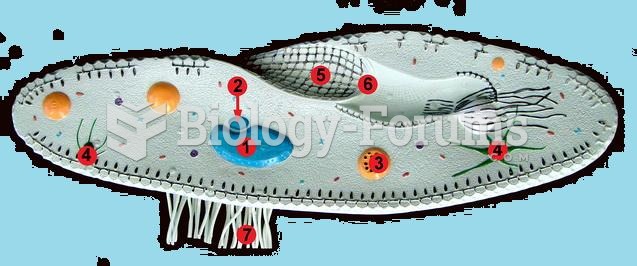 Lab: Paramecium Model
 Increased neurogenesis in the dentate gyrus following damage. The left panel shows (1) an ...
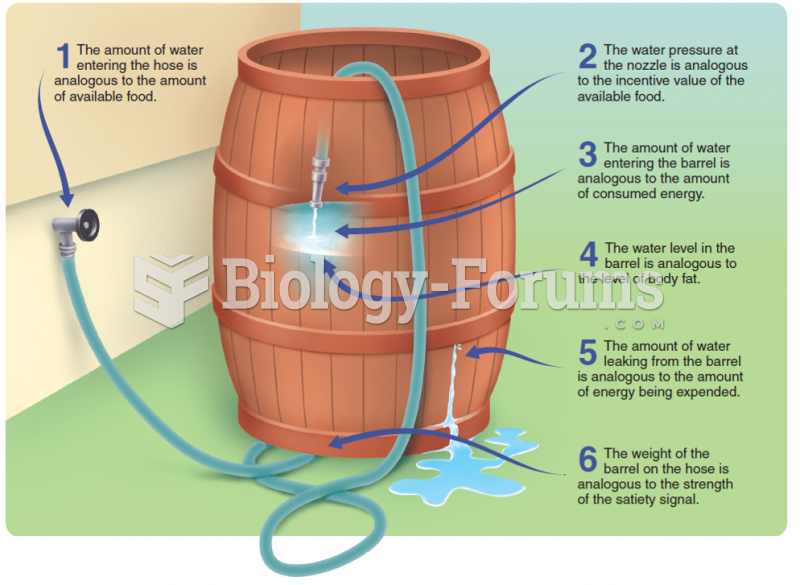 The leaky-barrel model: a settling-point model of eating and body weight homeostasis.
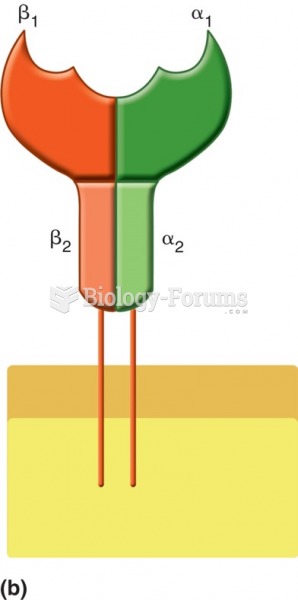 Schematic representation of MHC class II molecule, consisting of 2 α-domains and 2 β-domains, the ...