This topic contains a solution. Click here to go to the answer
|
|
|

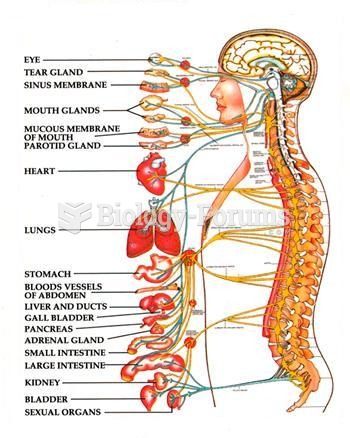 SPINAL NERVES DIAGRAM
 diagram
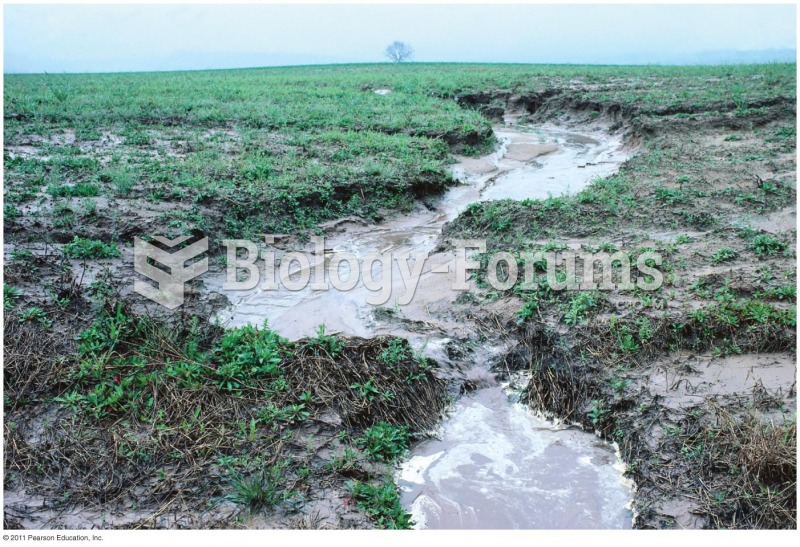 Farming Practices Influence Runoff and Sedimentation
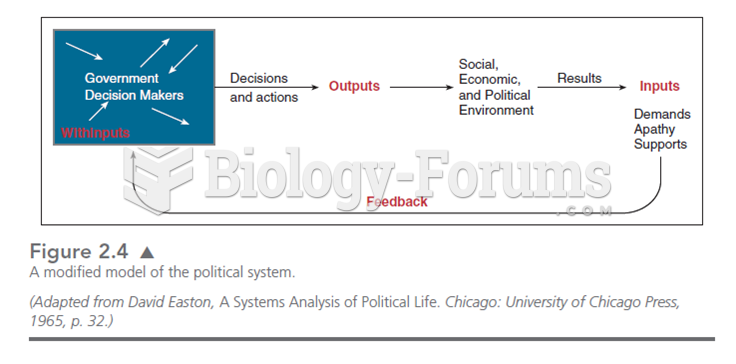 This modified model of Easton’s systems theory puts government decision makers as the source of pol
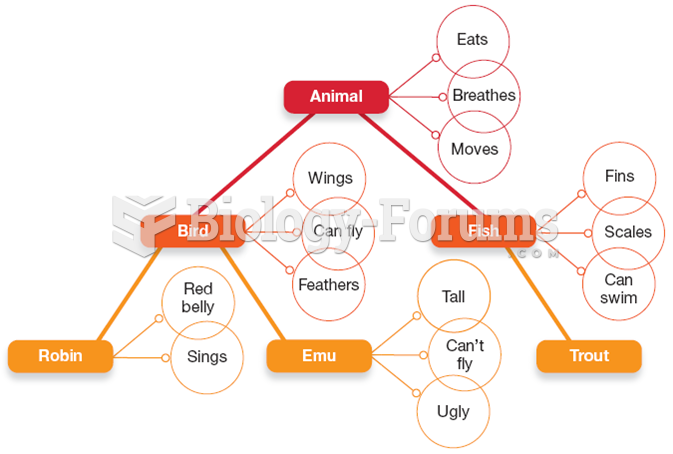 A Semantic Network Diagram for the Category “Animal”
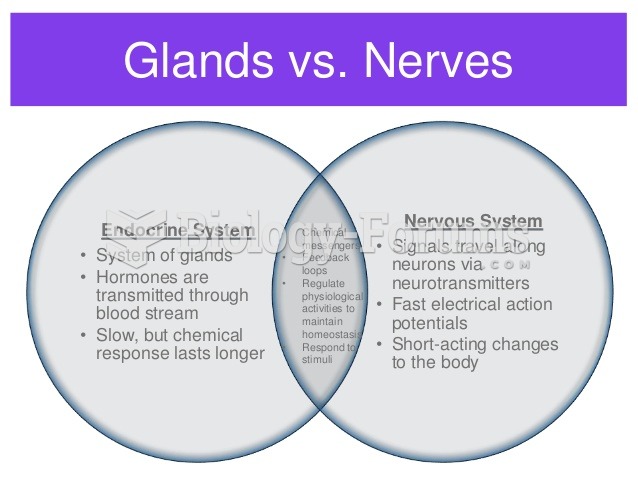 Venn Diagram of Nervous System and Endocrine System