This topic contains a solution. Click here to go to the answer
|
|
|

 brain diagram
 Blank cell diagram
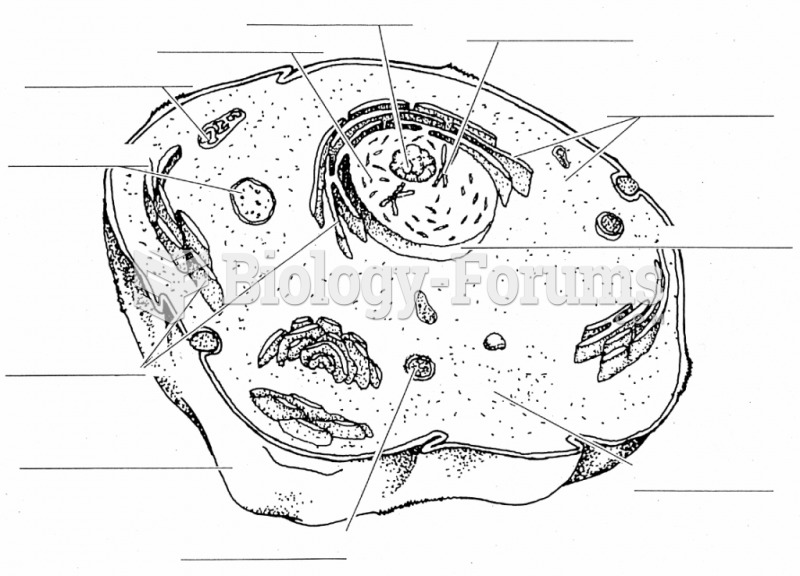
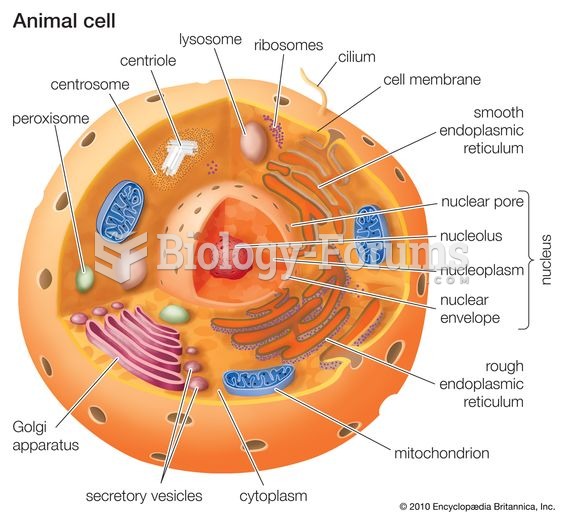 Diagram of a cell
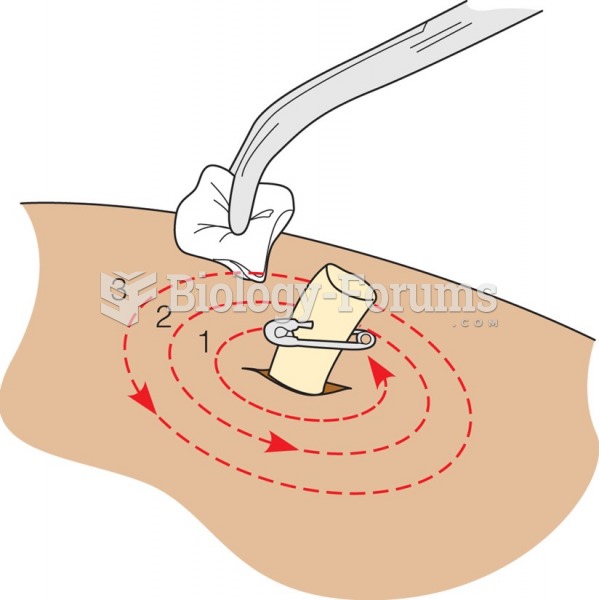 To cleanse an open wound, begin close to the wound and work outward in full or half circles.
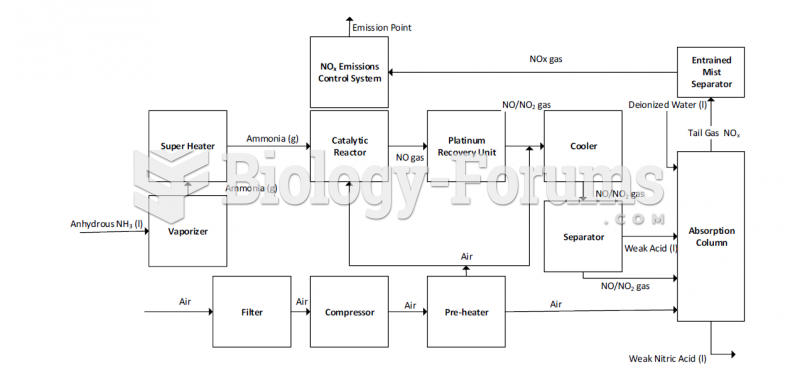 Block Diagram of Single-stage Pressure System for Dual-Stage Pressure Production of Nitric Acid
 How Aerosols Influence Climate