|
|
|

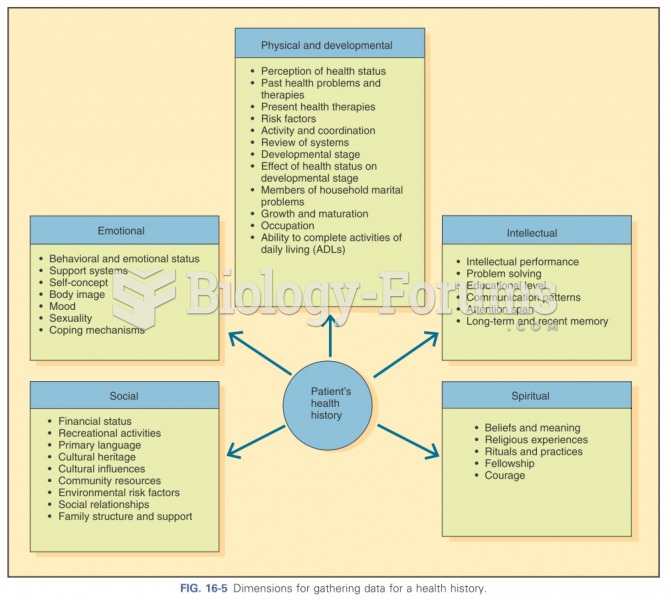 Dimensions for gathering data
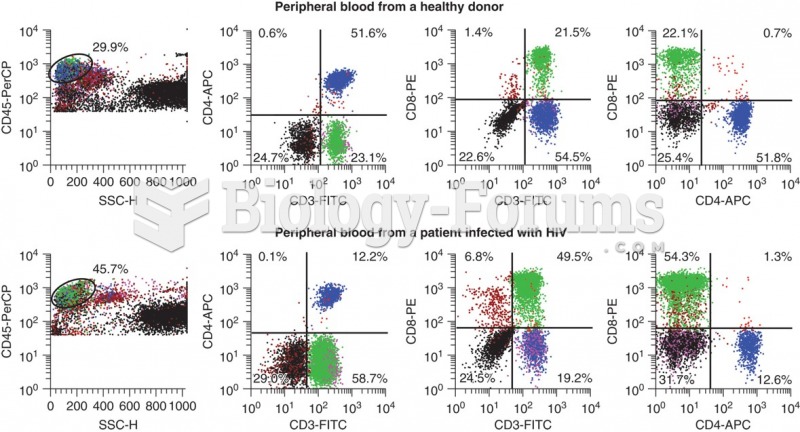 Flow cytometry data that shows the differences in CD3+ CD4+ cells that occur with HIV infection. ...
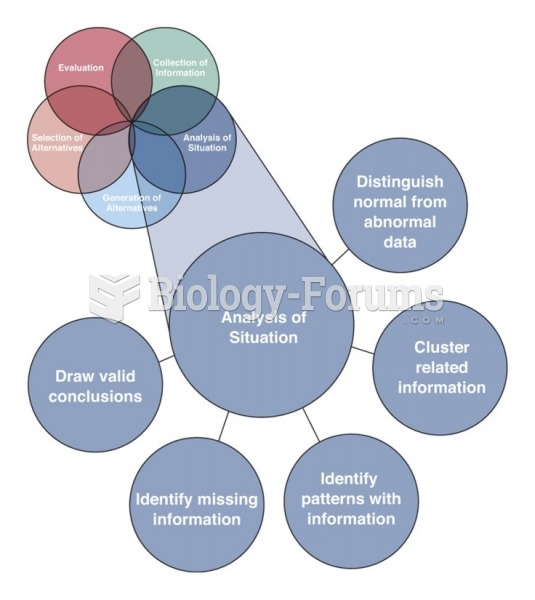 The five skills of the element Analysis of Situation
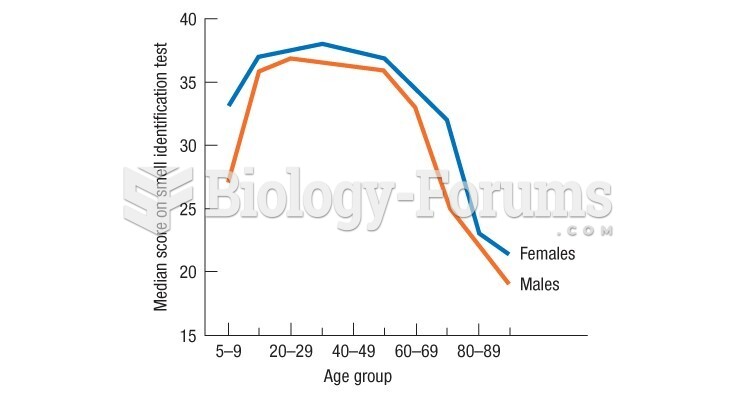 Doty's data show a very rapid drop in late adulthood in the ability to identify smells
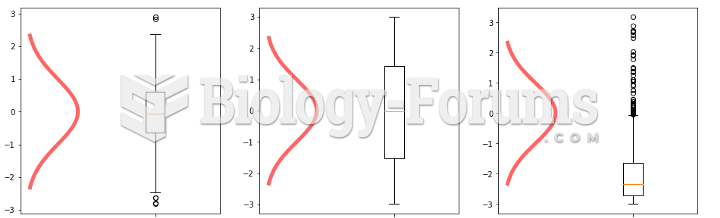 Histograms - Analysis and Data
 Gene-expression analysis generated from expression DNA microarrays