|
|
|

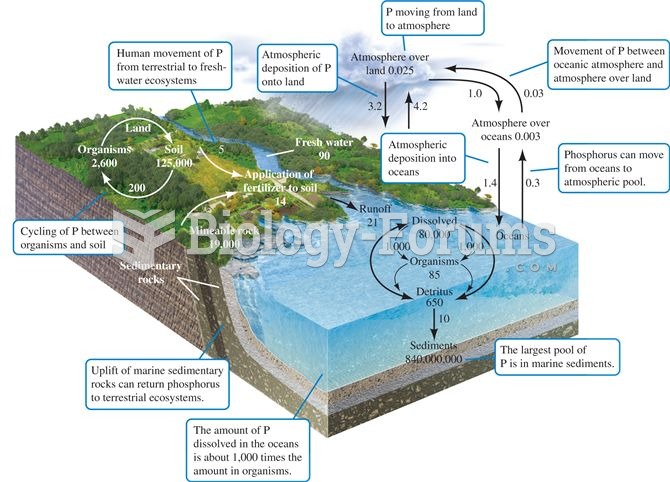 The phosphorus cycle. Numbers are 1012 g P or fluxes as 1012 g P per year (data from Schlesinger 199
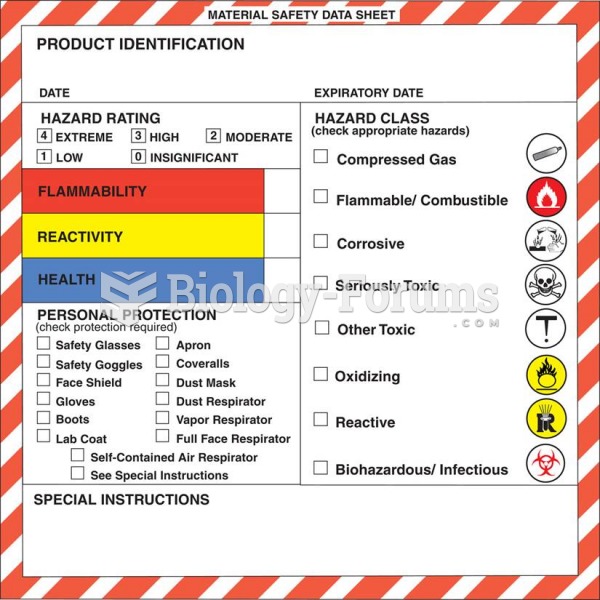 An example of a Material Safety Data Sheet (MSDS).
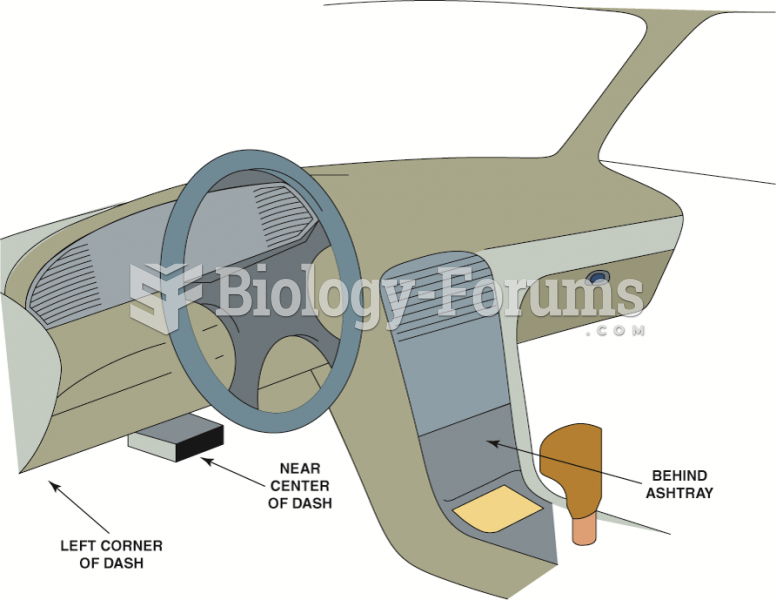 The data link connector (DLC) can be located in various locations.
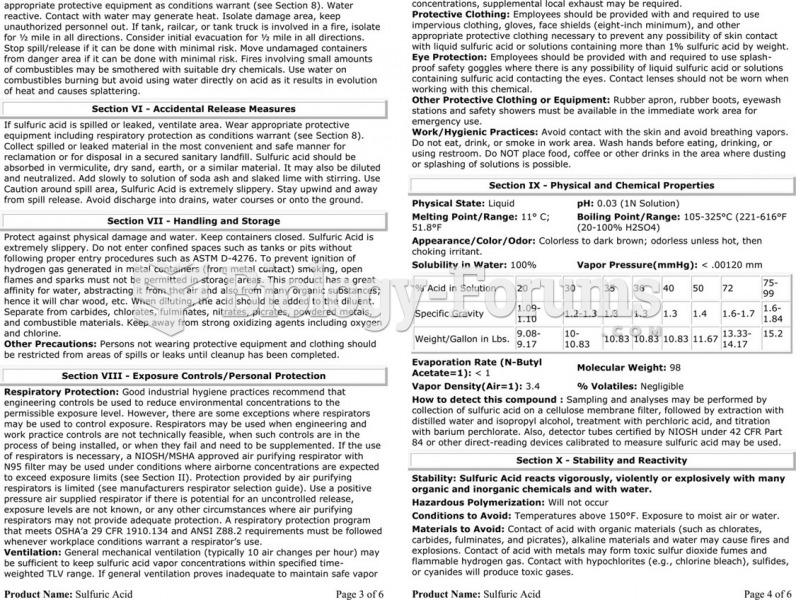 The material safety data sheet (MSDS) for sulfuric acid showing the detailed technical information ...
 Systems Analysis and Design, 10th Edition
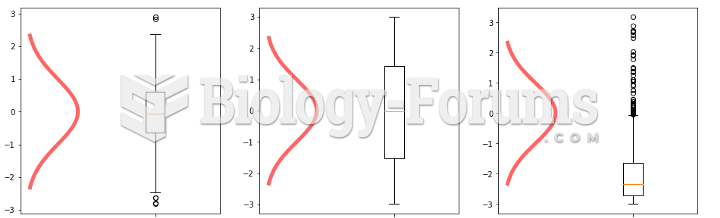 Histograms - Analysis and Data