This topic contains a solution. Click here to go to the answer
|
|
|

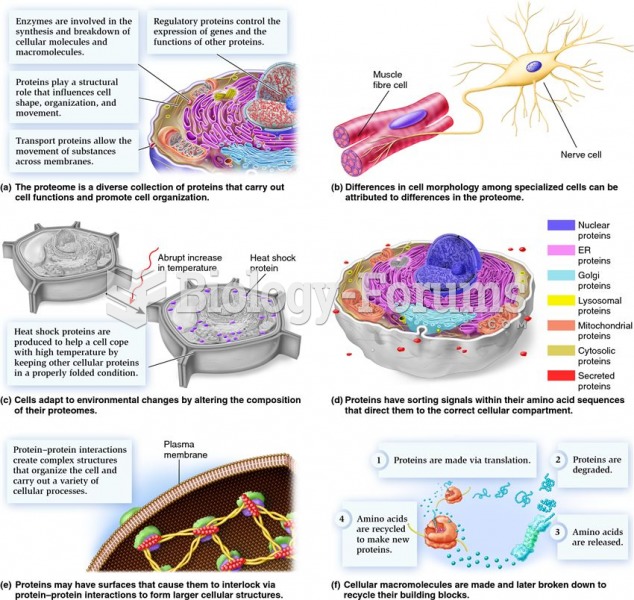 Proteomes and their relationship to cell structure, function, and organization.
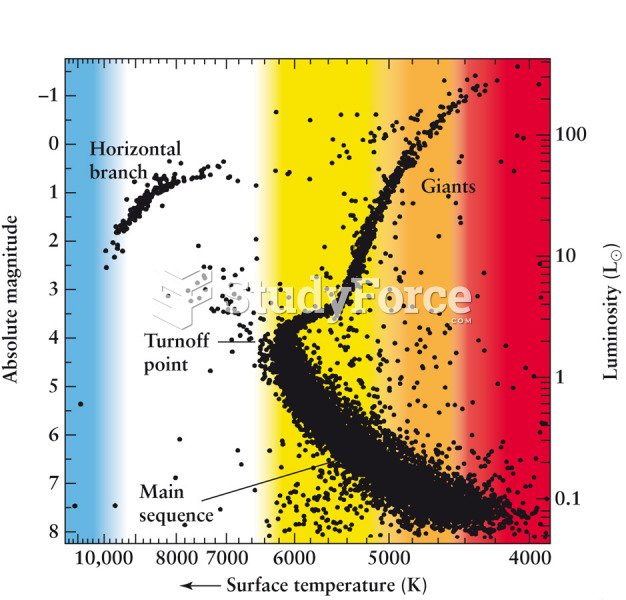 An H-R Diagram of a Globular Cluster
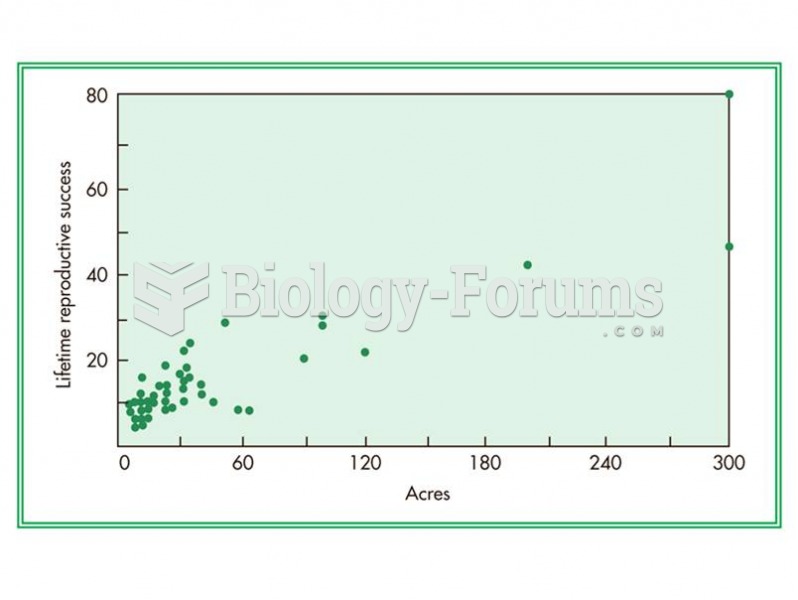 The relationship between number of acres a Kipsigis man owns and the number of offspring he has duri
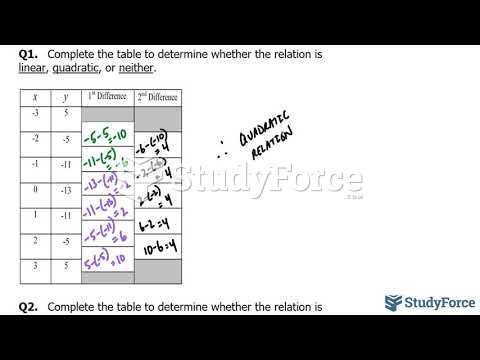 How to determine if a table of values represents a linear or quadratic relationship
 How to use a tree diagram to find the probability
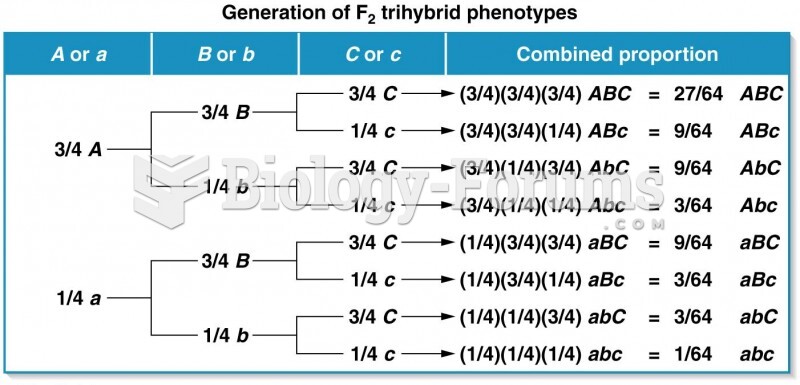 Generation of the F2 trihybrid phenotypic ratio using the forked-line method