This topic contains a solution. Click here to go to the answer
|
|
|

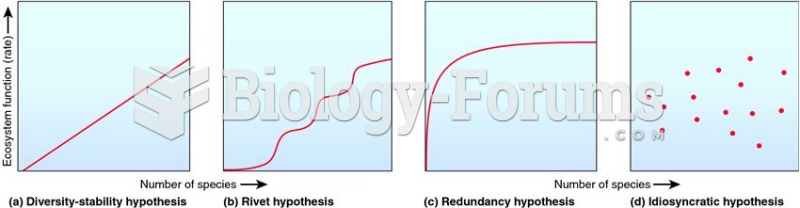 Four main models that describe the relationship between ecosystem function and biodiversity.
 Bacteria Diagram
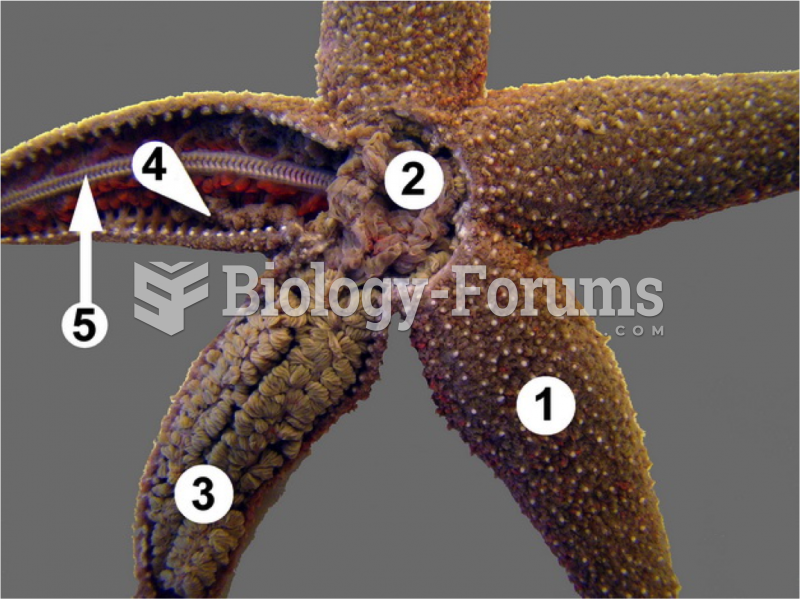 Echinoderm Diagram with labels
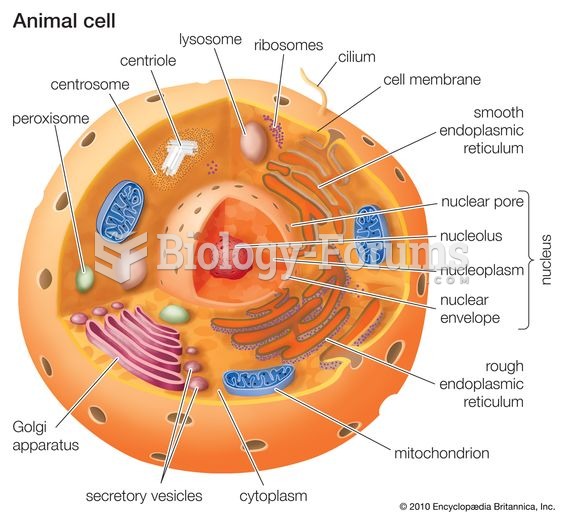 Diagram of a cell
 Relationship of a DNA base sequence to peptide structure