This topic contains a solution. Click here to go to the answer
|
|
|

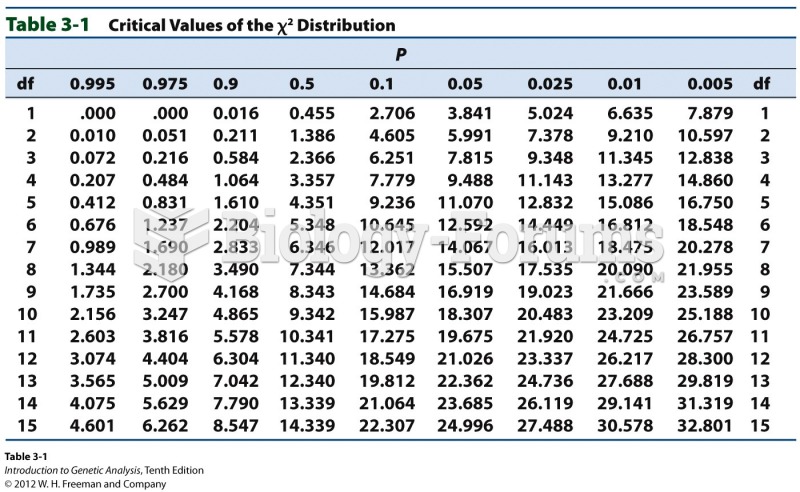 Critical Values of the Chi-Square Distribution
 Injecting an IV push (bolus) medication; B, into a primary infusion line
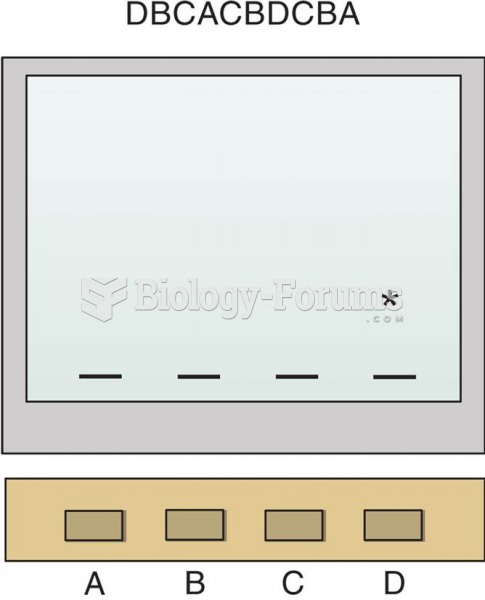 The Serial Reaction Time Task
 In-line blending is the most accurate method for blending ethanol with gasoline because computers ...
 Embryonic Period - Embryonic Heart
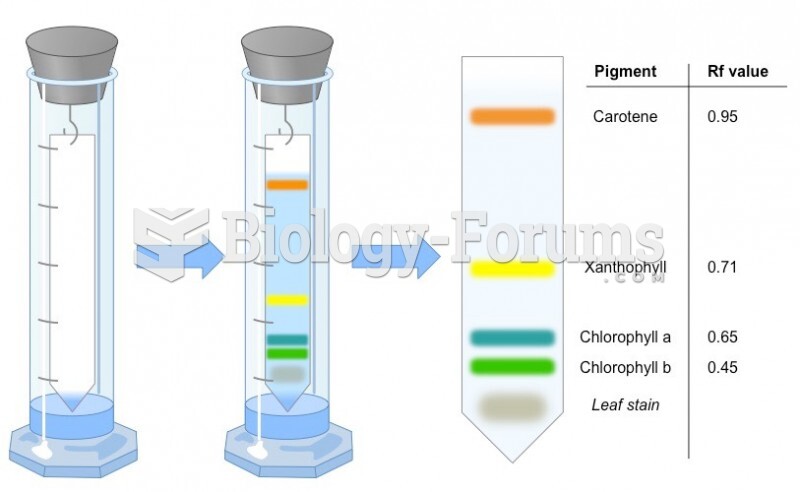 Please explain the different Rf values for xanthophyll’s in paper chromatography compared to ...