This topic contains a solution. Click here to go to the answer
|
|
|

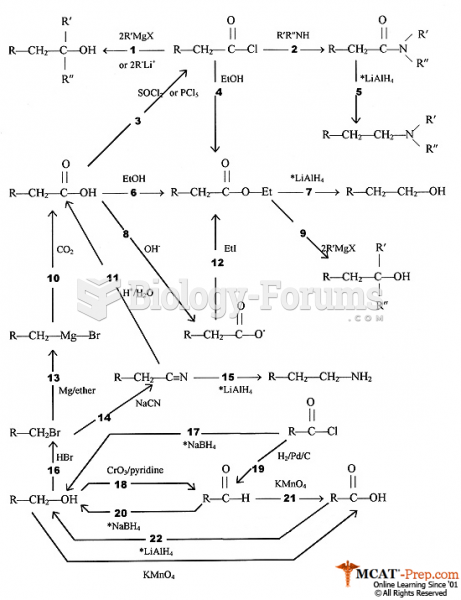 Organic Synthesis Flow Chart
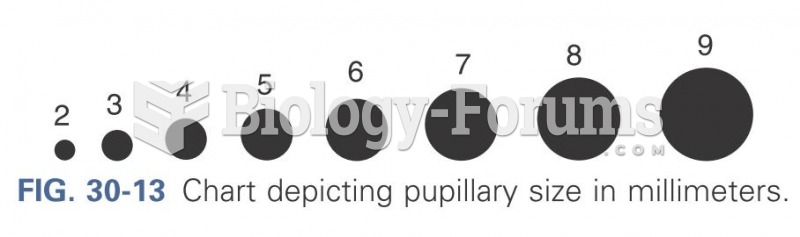 Chart depicting pupillary size in millimeters
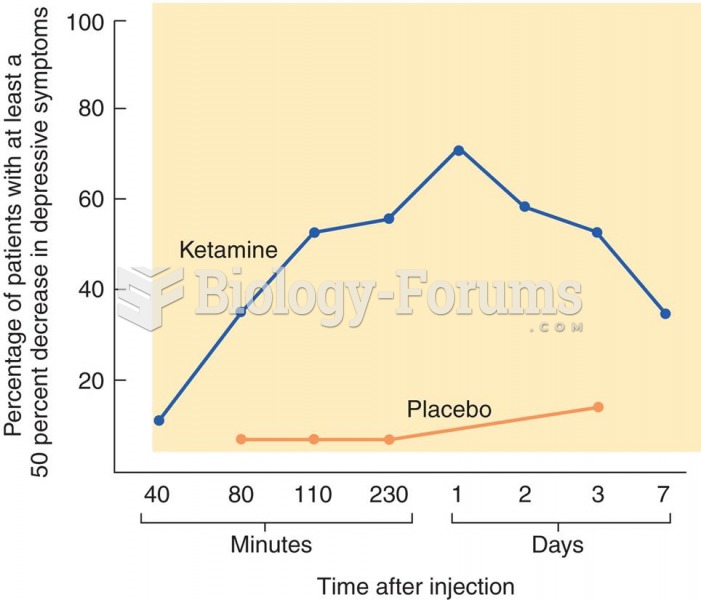 Treatment of Depression with Ketamine The graph shows the effects of ketamine on symptoms of depress
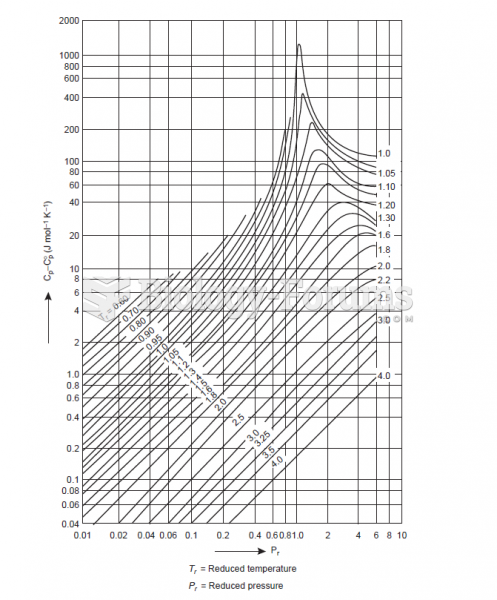 Excess heat capacity chart
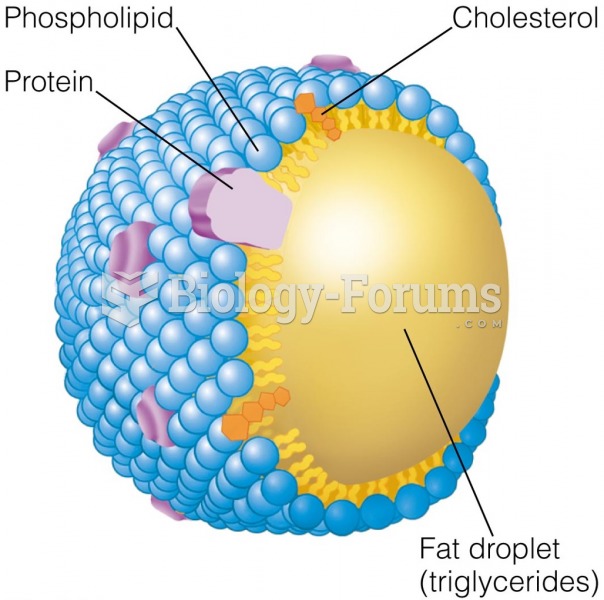 Chylomicron Chylomicrons are one type of lipoprotein
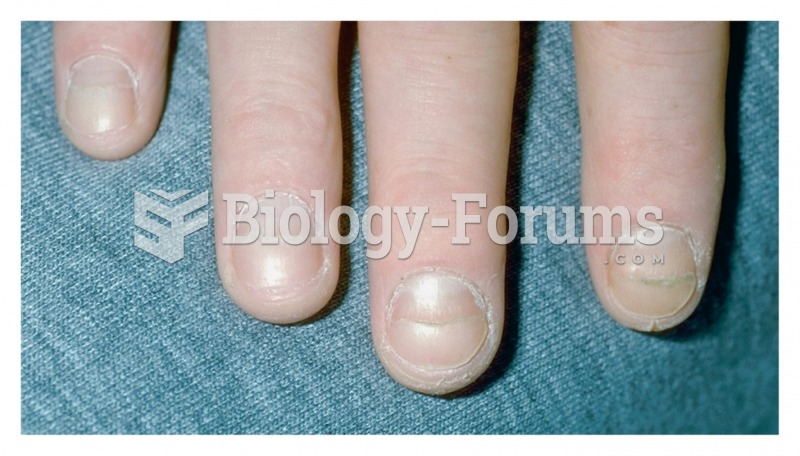 Beau’s line