|
|
|

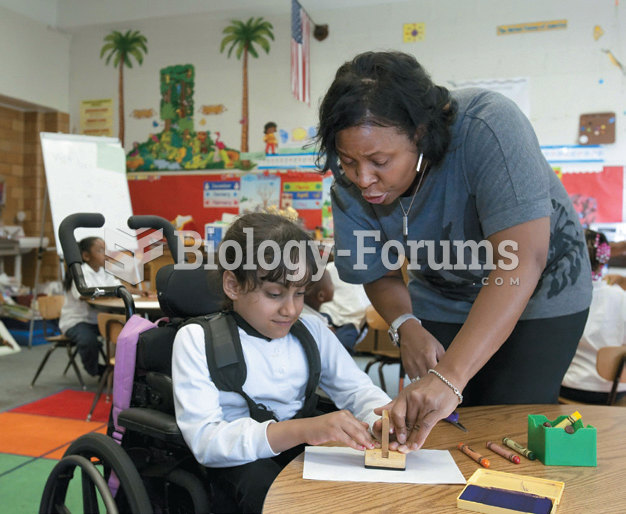 Children with disabilities used to be sent to special schools. In a process called mainstreaming or ...
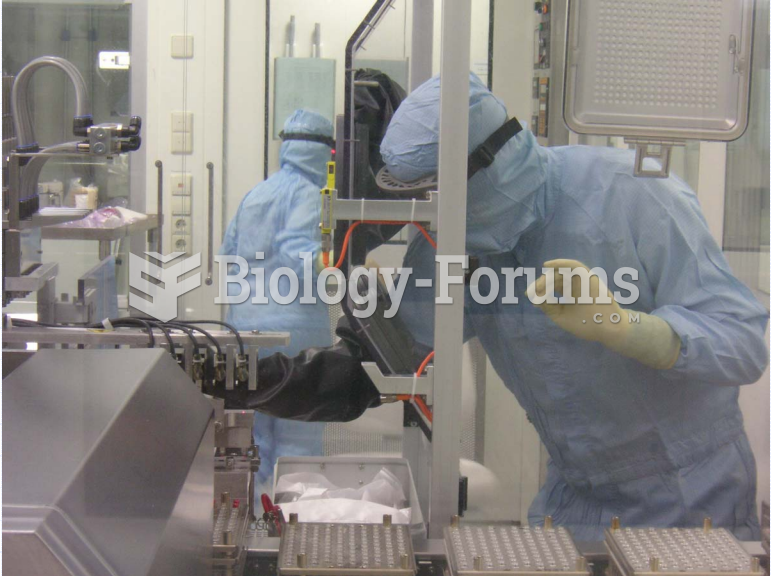 Risk & Aseptic Processing - RABs Filling Line
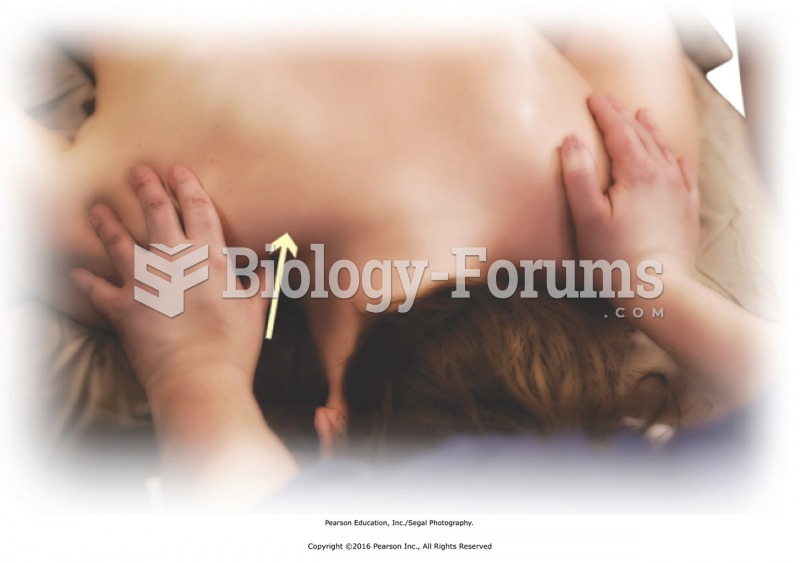 Apply direct thumb pressure into points along the upper trapezius from base of neck to shoulder. ...
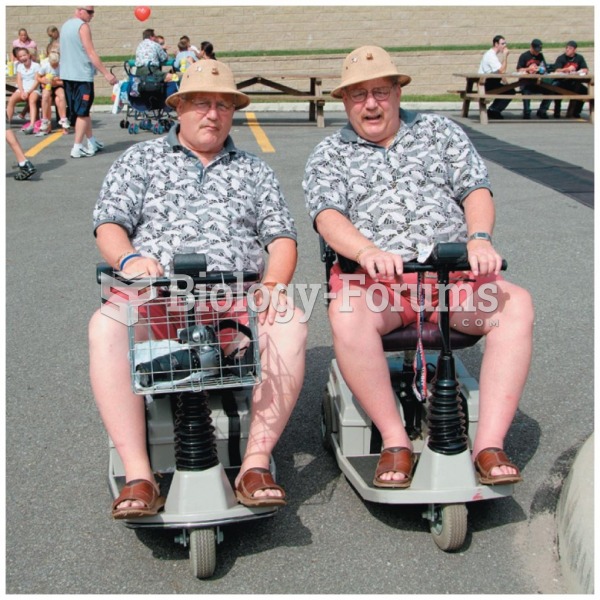 People who share genes will often have similar body weights
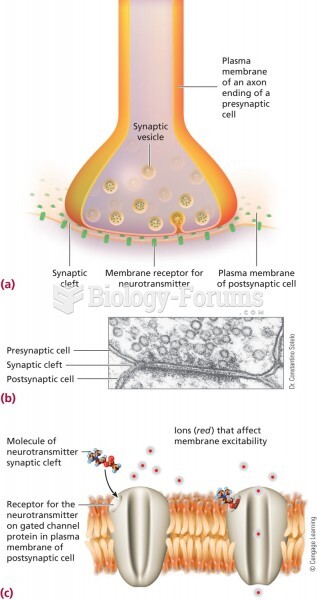 The synapse and synaptic transmission. (a) A thin cleft, called the synapse, separates one cell from
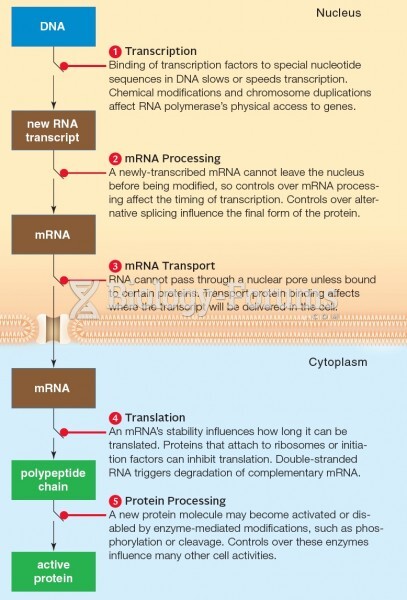 Points of control over eukaryotic gene expression.