This topic contains a solution. Click here to go to the answer
|
|
|

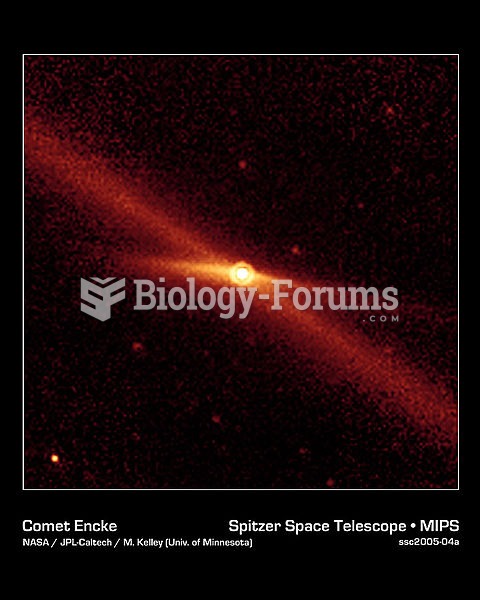 the comet Encke riding along its pebbly trail of debris (long diagonal line) between the orbits of M
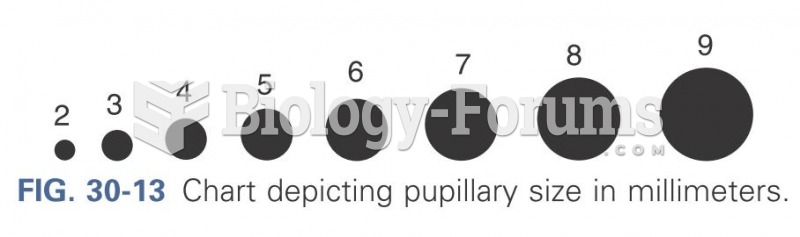 Chart depicting pupillary size in millimeters
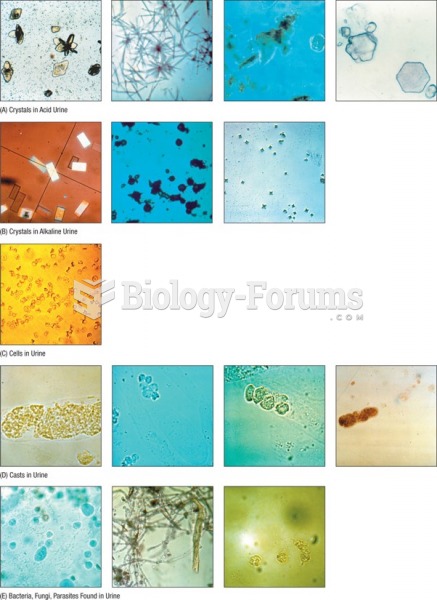 Urine sediment chart.
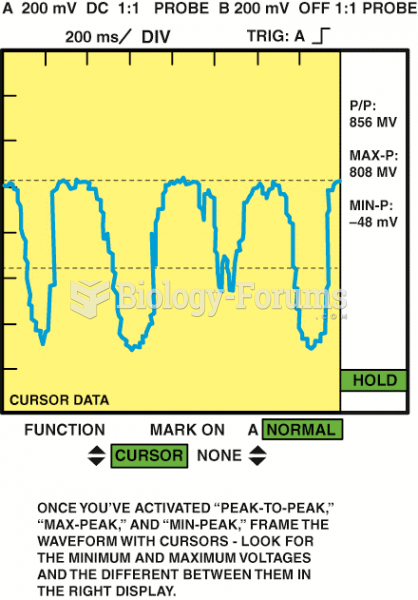 Using the cursors on the oscilloscope, the high- and low-oxygen sensor values can be displayed on ...
 The Last Century Trends
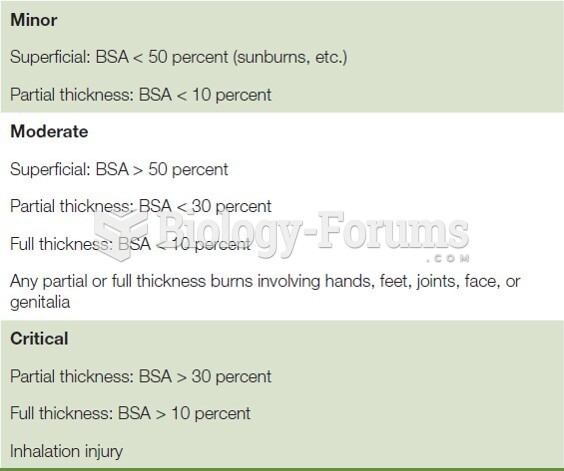 Burn Severity Chart