|
|
|

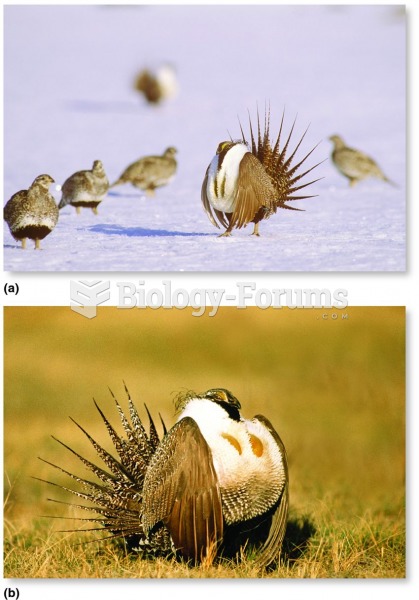 Some male birds and mammals congregate in communal courting grounds called leks.
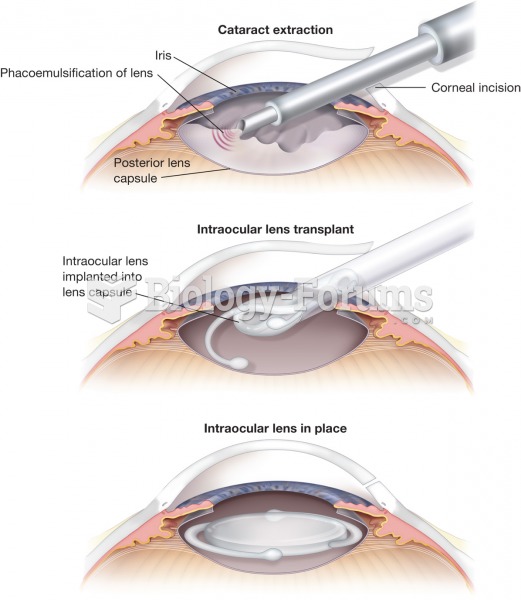 Cataract extraction. The procedure involves a surgical removal of a cataract lens and its replacemen
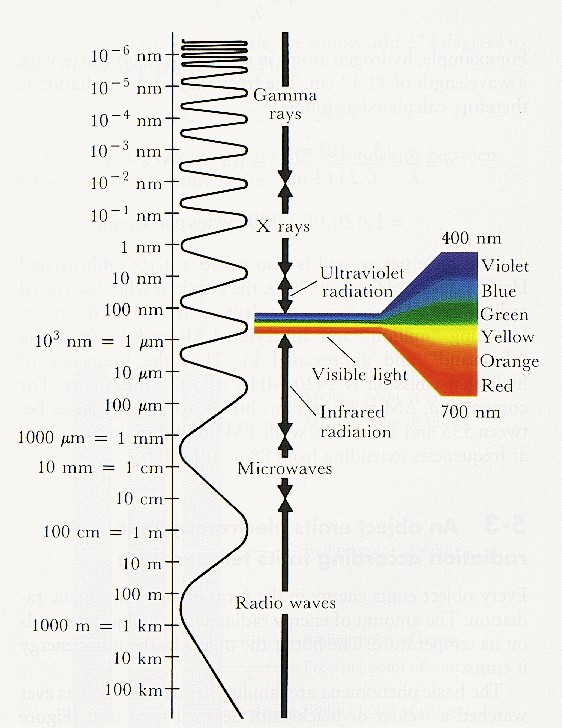 Electromagnetic Radiation Chart
 An upward-sloping spark line usually indicates a mechanical engine problem or a lean air–fuel ...
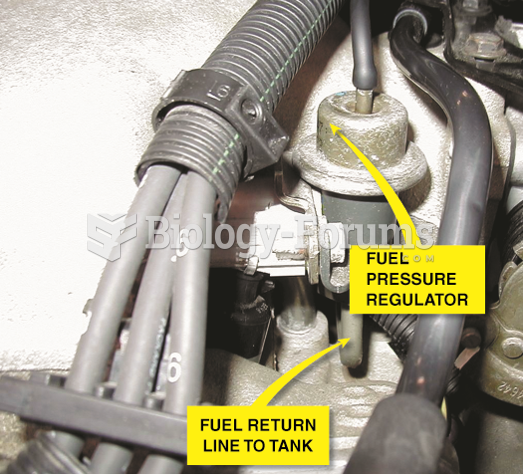 Fuel should be heard returning to the fuel tank at the fuel return line if the fuel pump and ...
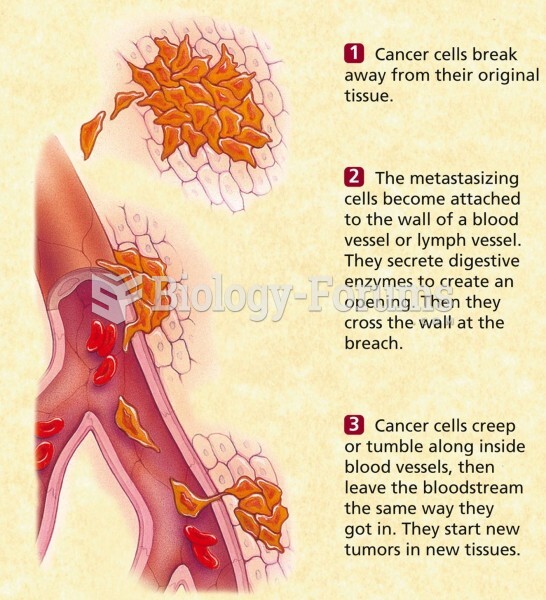 Cancer cells can move to new locations in the body, a process called metastasis