|
|
|

 Cyanobacteria of the (a) genus Synechococcus form (b) mats that line hot springs around the world.
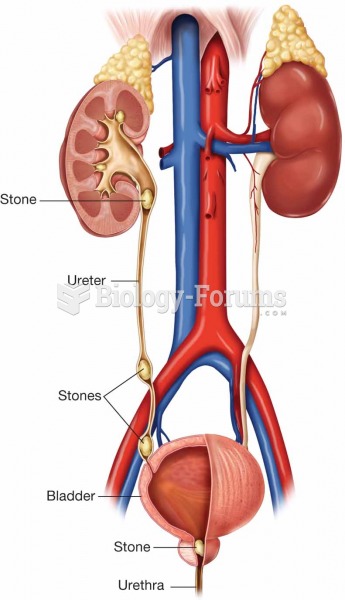 Renal calculi (stones) can form in several areas within the urinary tract. When they form in the kid
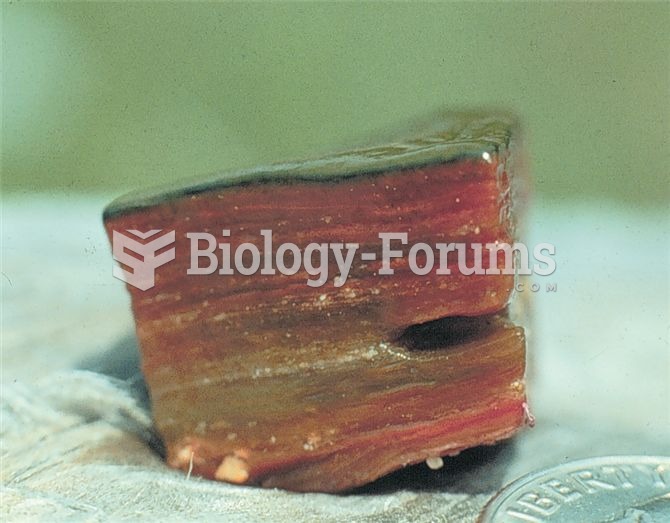
 Endocarditis. The human heart has been sectioned to reveal the left ventricle and origin of the aort
 In-line blending is the most accurate method for blending ethanol with gasoline because computers ...
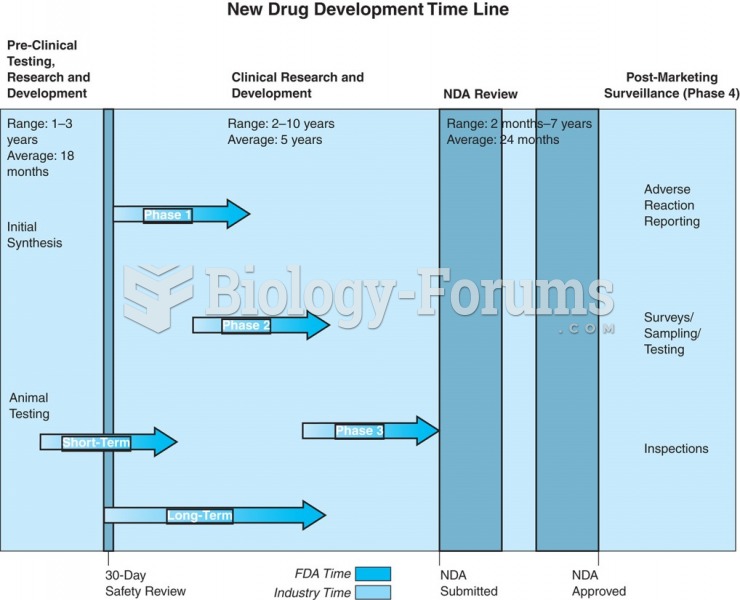 A new drug development time line with the four phases of drug approval.
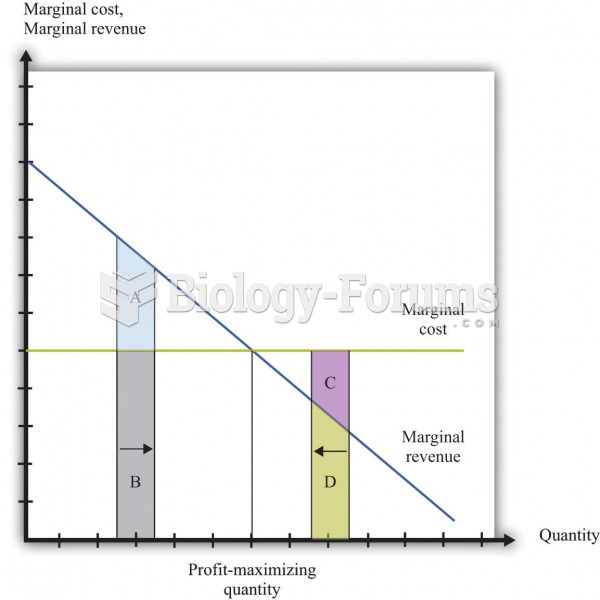 Profit-maximizing Chart