This topic contains a solution. Click here to go to the answer
|
|
|

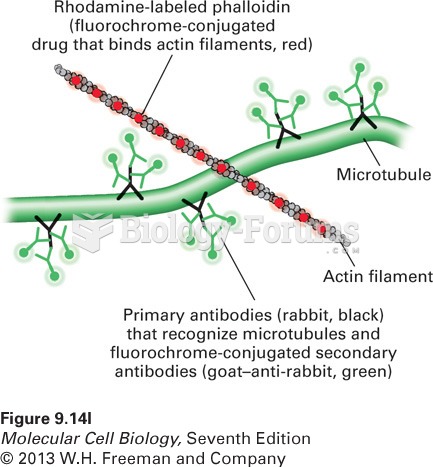 Double-label fluorescence microscopy can visualize the relative distributions of
 Suzuki Harunobu, Two Courtesans, Inside and Outside the Display Window, Japanese.
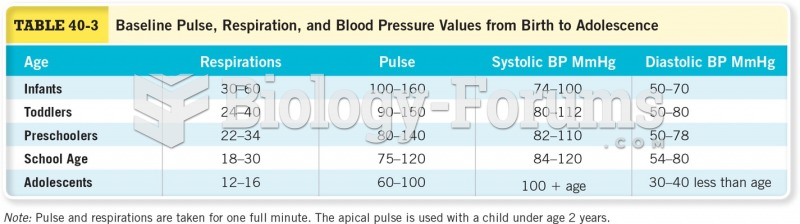 Baseline Pulse, Respiration, and Blood Pressure Values from Birth to Adolescence
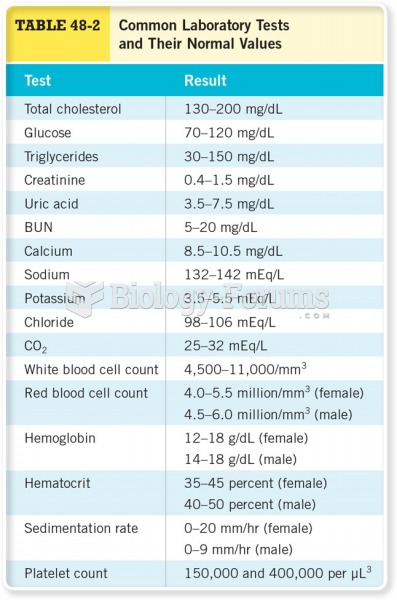 Common Laboratory Tests and Their Normal Values
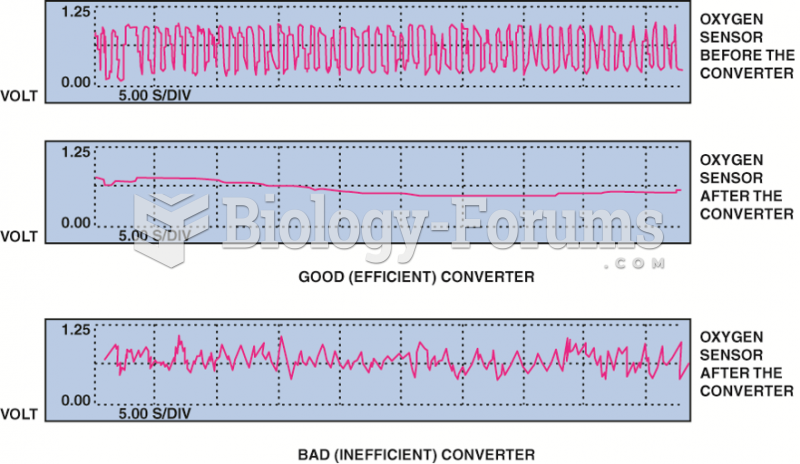 The post-catalytic converter oxygen sensor should display very little activity if the catalytic ...
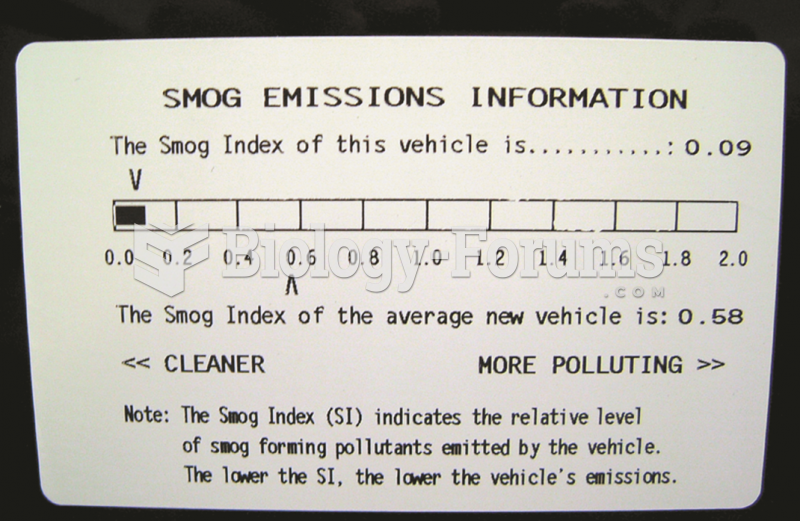 This label on a Toyota Camry hybrid shows the relative smog-producing emissions, but this does not ...