This topic contains a solution. Click here to go to the answer
|
|
|

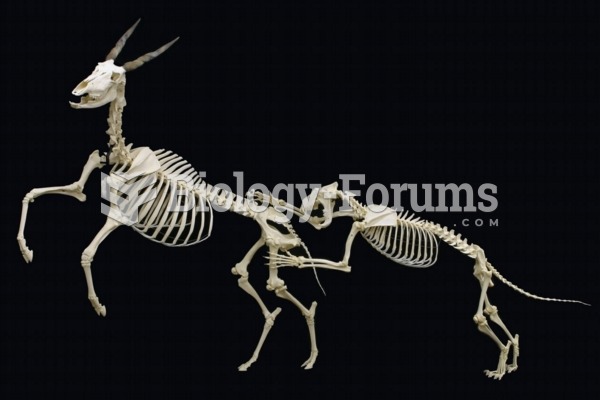 A skeletal mount of an African Lion attacking a Common Eland on display at The Museum of Osteology,
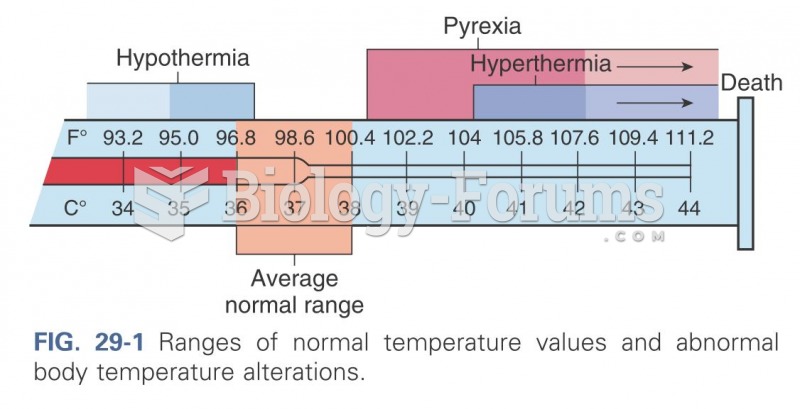 Ranges of normal temperature values
 Suzuki Harunobu, Two Courtesans, Inside and Outside the Display Window.
 Sociologists disagree about the relative significance of race and social class in determining social ...
 Migration of Surface Cyclones Relative to Rossby Waves
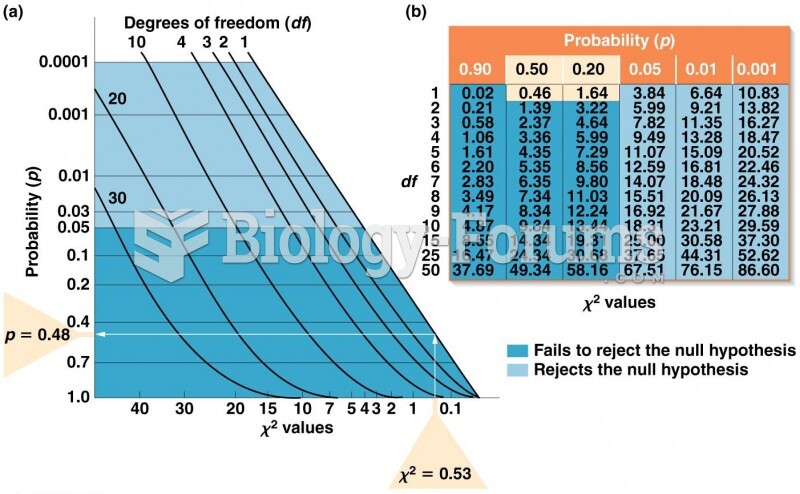 (a) Graph for converting values to p values. (b) Table of values for selected values of df