This topic contains a solution. Click here to go to the answer
|
|
|

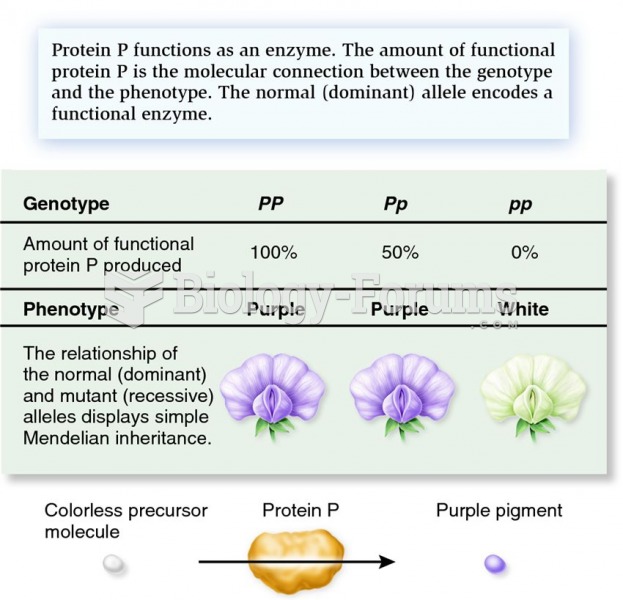 How genes produce proteins that determine traits in a simple dominant-recessive relationship.
 Technique of Indirect Percussion; Percussion Strike
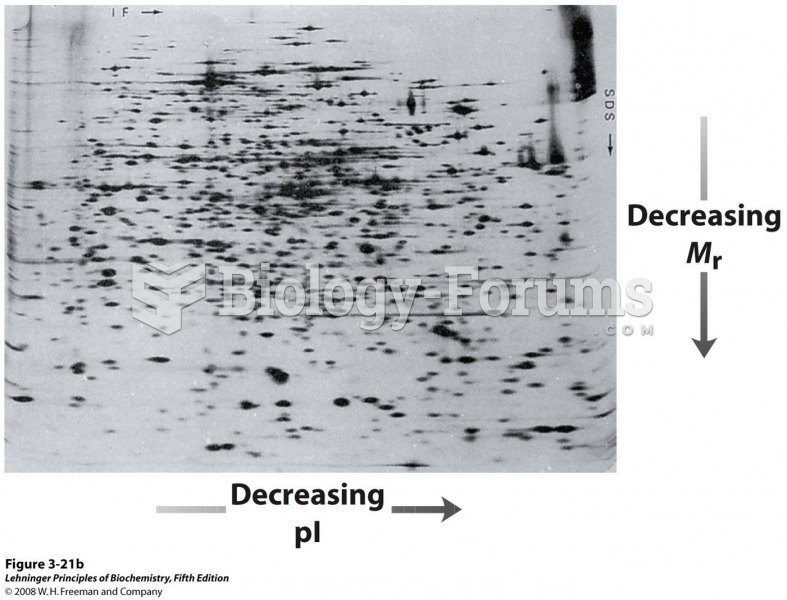 More than 1,000 different proteins from E. coli can be resolved using this technique
 The paired-image subtraction technique, which is commonly employed in cognitive neuroscience. Here ...
 Use a graphical method to find the length of the loan to the nearest year
 The relationship between maternal age and the frequency of trisomy 21 (Down syndrome). The risk incr