This topic contains a solution. Click here to go to the answer
|
|
|

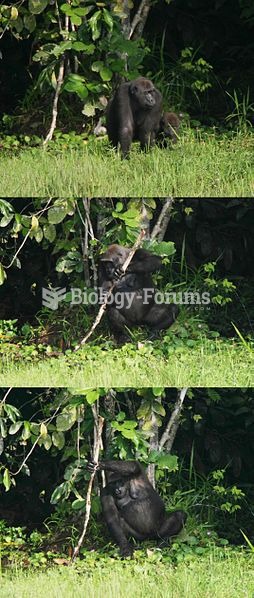 A female gorilla exhibiting tool use by using a tree trunk as a support whilst fishing herbs.
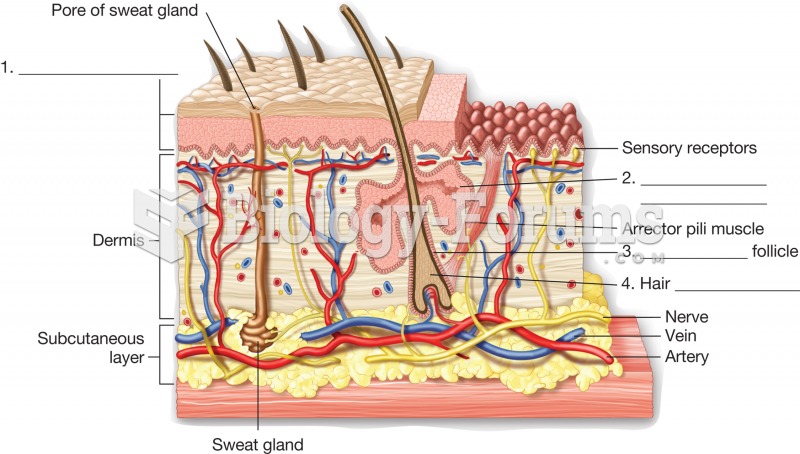 Anatomy of the skin. Illustration of a section of skin showing key structures.
 Mollie Wilson, Kwakwaka'wakw pictograph recording a 1927 potlatch showing coppers and cows, ...
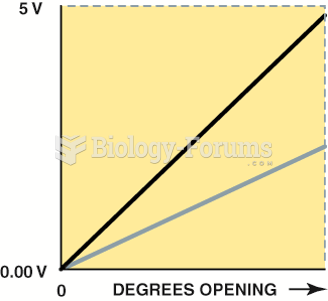 A typical accelerator pedal position (APP) sensor, showing two different output voltage signals ...
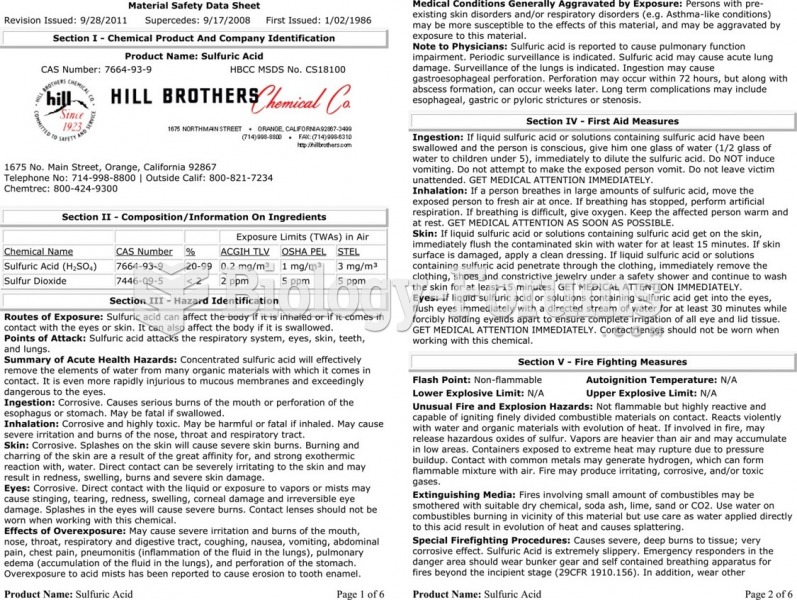 The material safety data sheet (MSDS) for sulfuric acid showing the detailed technical information ...
 Near-uniform distribution of nesting seabirds