This topic contains a solution. Click here to go to the answer
|
|
|

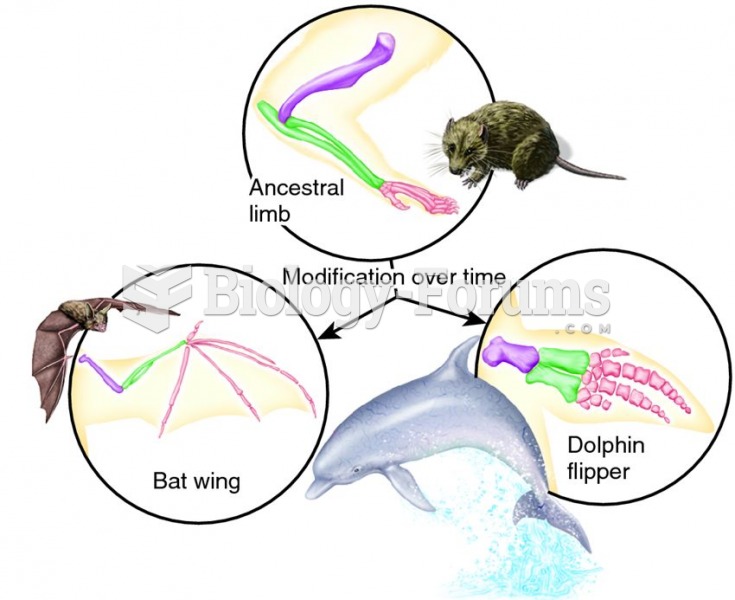 An example showing a modification that has occurred as a result of biological evolution
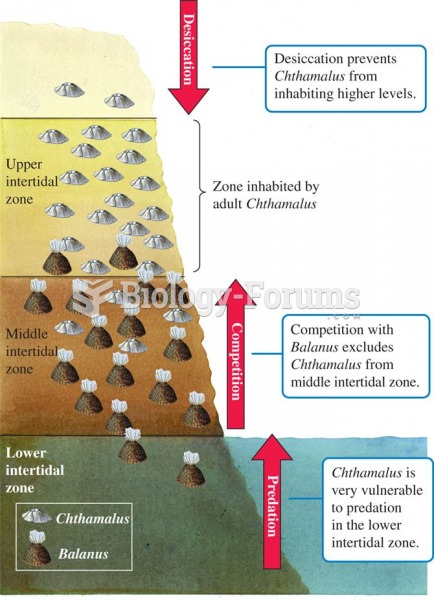 Environmental factors restricting the distribution of Chthamalus to the upper intertidal zone.
 Positron emission tomography (PET) image showing the difference in the metabolic activity of the bra
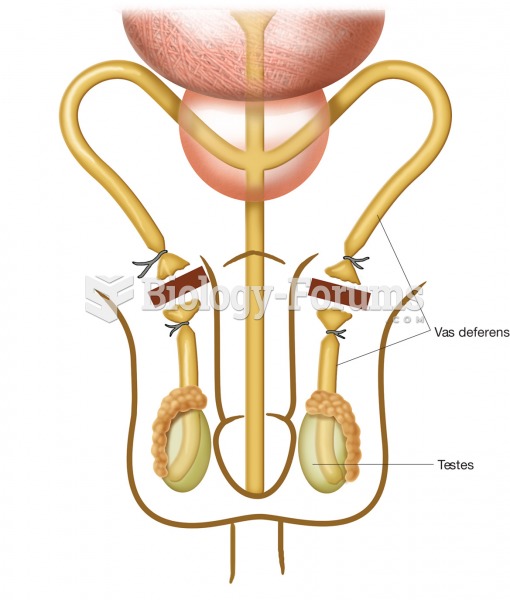 A vasectomy, showing how each vas deferens is tied off in two places and then a section is removed f
 An enlarged heart showing the results of cardiomyopathy.
 The underhood decal showing that this Lexus RX-330 meets both national (Tier 2; BIN 5) and ...