This topic contains a solution. Click here to go to the answer
|
|
|

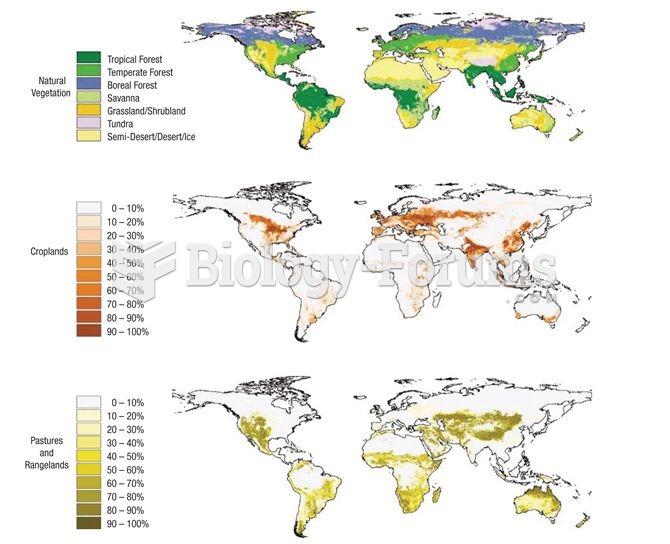 Extent of agricultural activity across the planet (data from Foley et al. 2005).
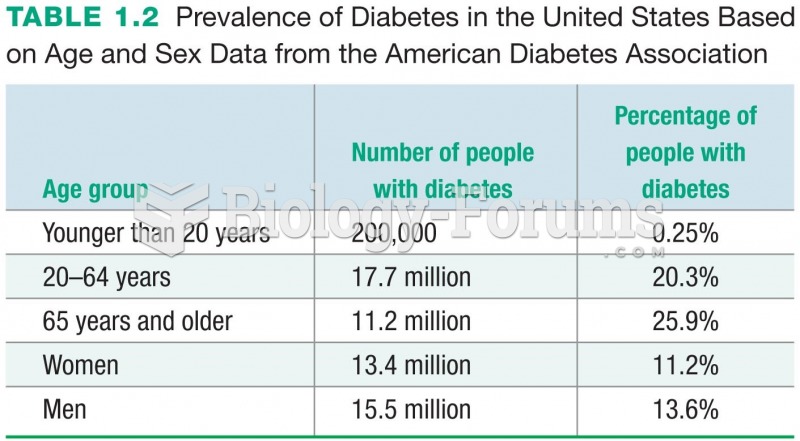 Prevalence of Diabetes in the United States Based on Age and Sex Data from the American Diabetes ...
 A beam-type torque wrench that displays the torque reading on the face of the dial. The beam display ...
 Typical engine analyzer hookup that includes a scope display. (1) Coil wire on top of the ...
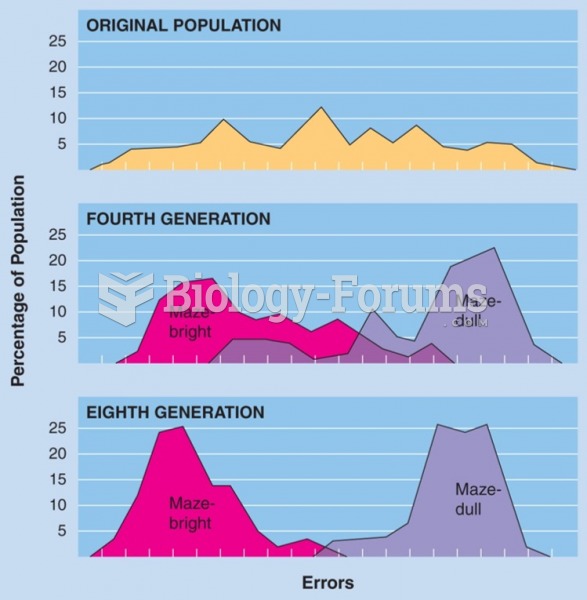 Selective breeding of maze-bright and maze-dull strains of rats by Tryon (1934). (Data from Cooper, ...
 Basic Marketing Research: Using Microsoft Excel Data Analysis