This topic contains a solution. Click here to go to the answer
|
|
|

 Threat display by a Sydney funnel-web spider (Atrax robustus).
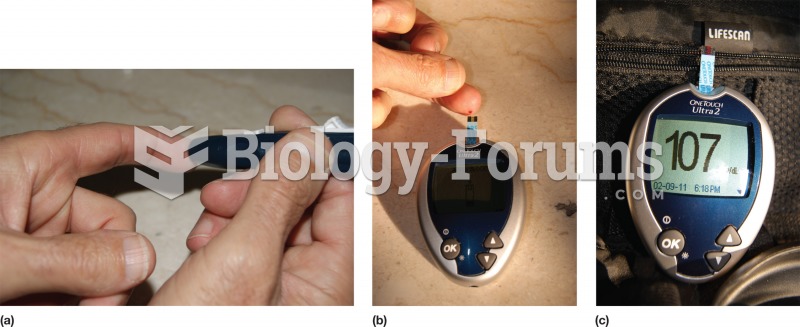 Blood glucose measurement. A postprandial test may be self-administered. (a) A lance pierces the ski
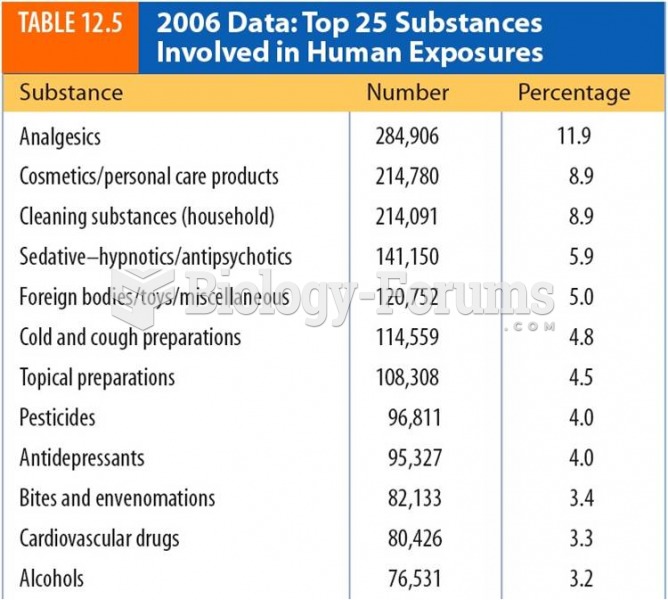 2006 Data:Top 25 Substances Involved in Human Exposures
 A typical large tool box, showing just one of many drawers.
 Display of Canapés
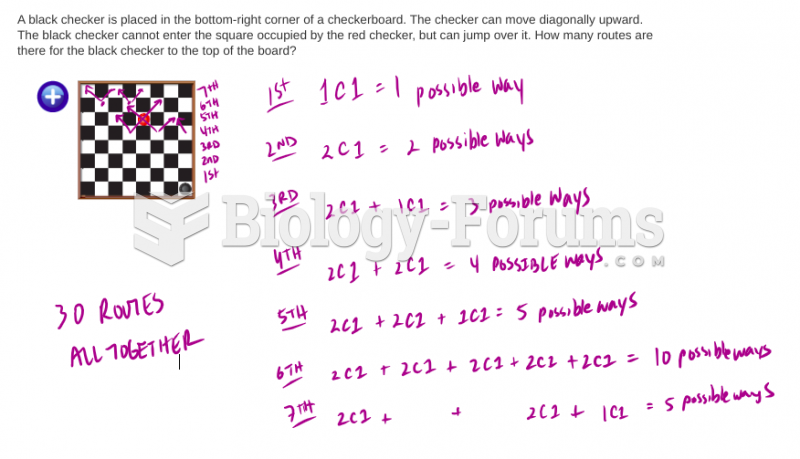 Data management questions