This topic contains a solution. Click here to go to the answer
|
|
|

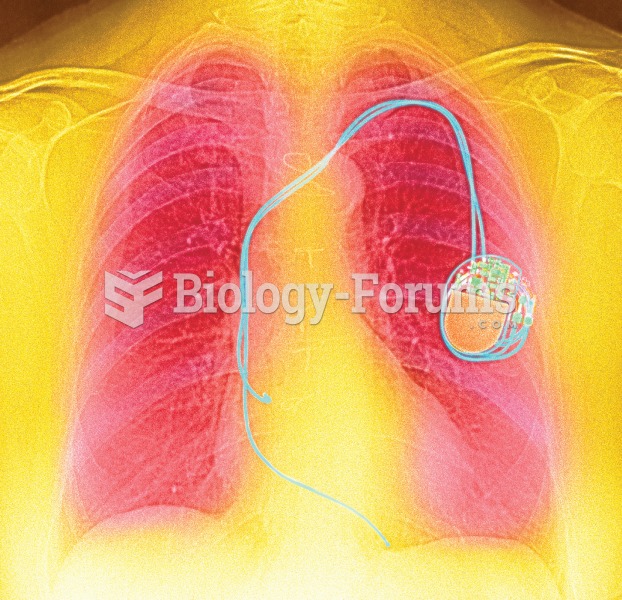 Color enhanced X-ray showing a pacemaker implanted in the left side of the chest and the electrode w
 Uranus's southern hemisphere in approximate natural colour (left) and in shorter wavelengths (r
 A cutaway of a typical water pump showing the long bearing assembly and the seal. The weep hole is ...
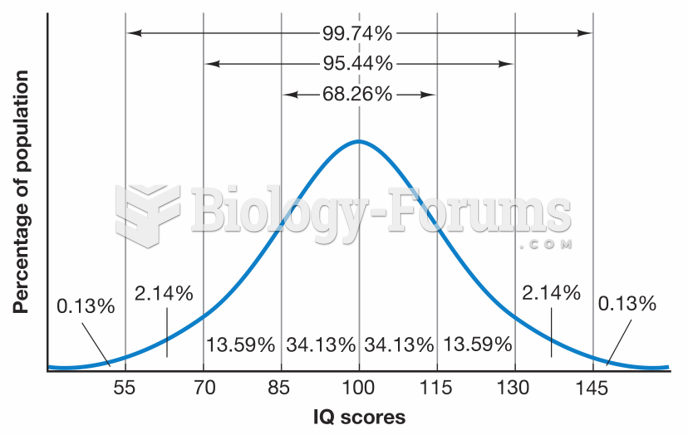 Expected Distribution of IQ Scores
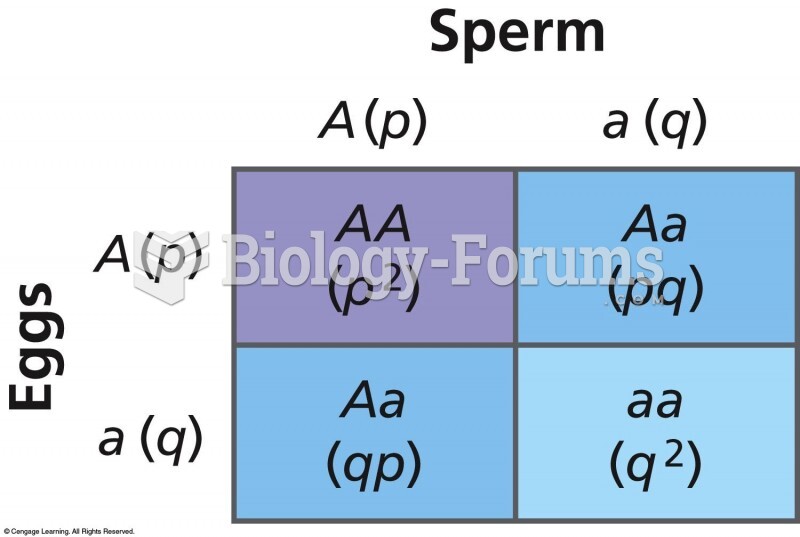 The frequency of the dominant and recessive alleles in the gametes of the parental generation determ
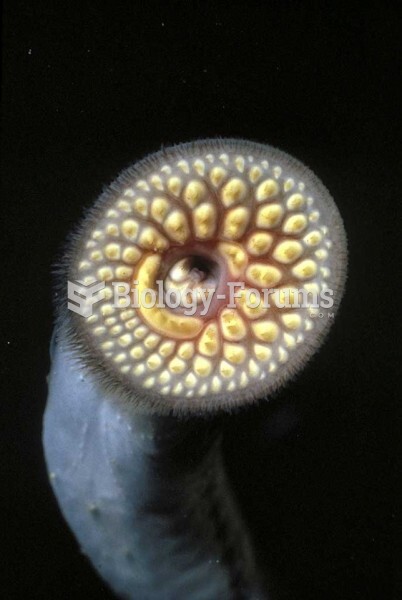 Sea Lamprey mouth, showing teeth.