|
|
|

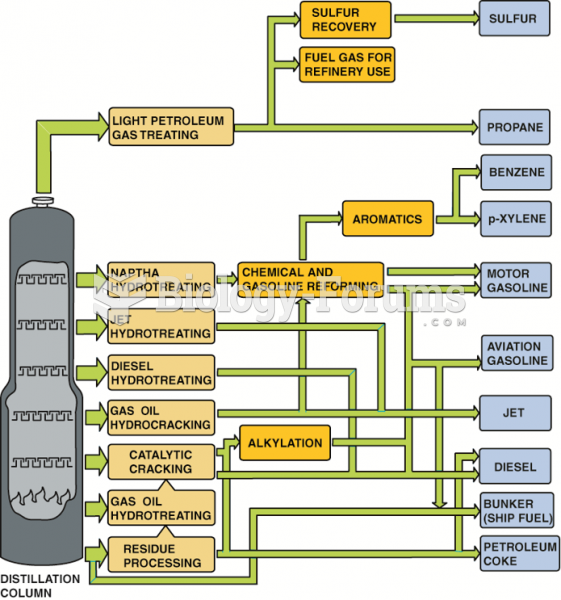 The crude oil refining showing most of the major steps and processes.
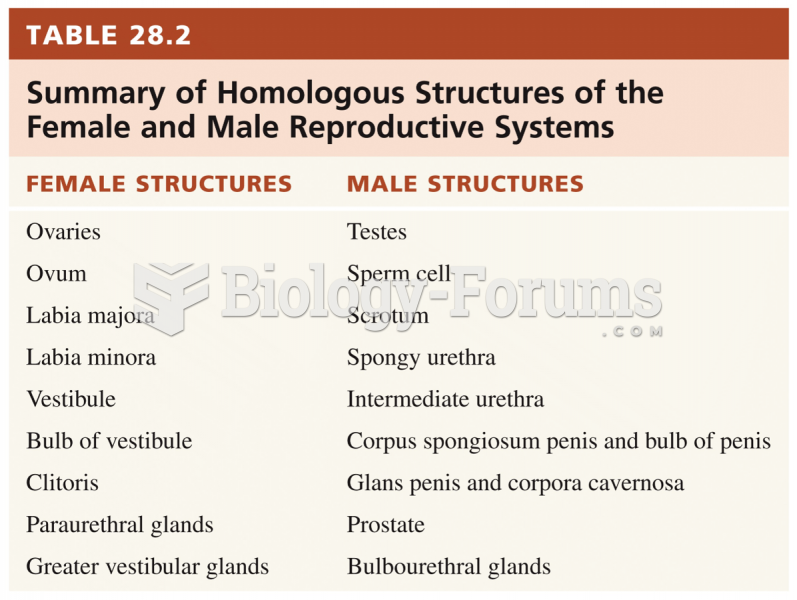 Summary of Homologous Structures of the Female and Male Reproductive Systems
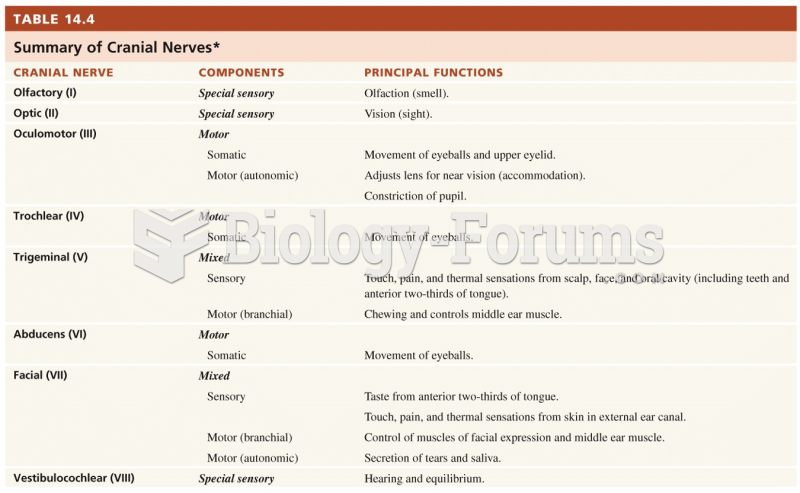 Summary of Cranial Nerves
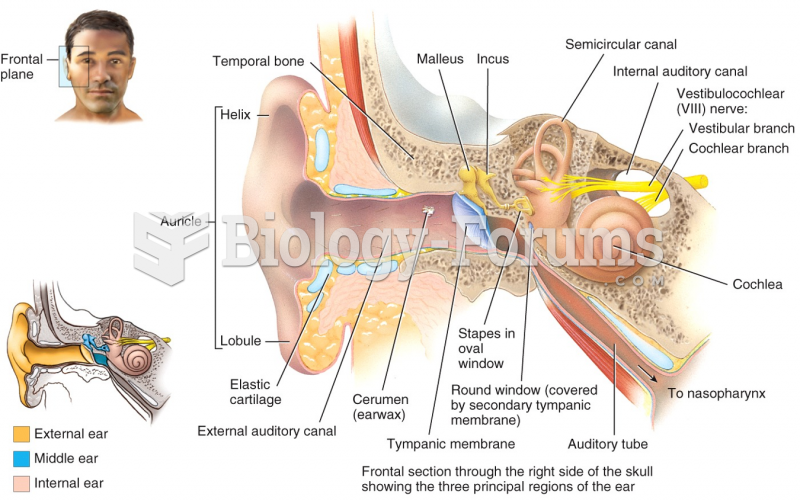 Frontal section through the right side of the skull showing the three principal regions of the ear
 Data management questions
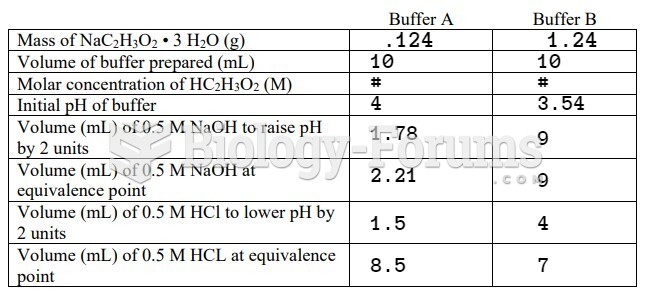 data
data