|
|
|

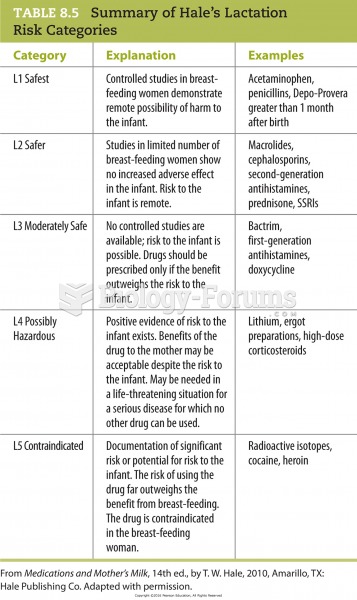 Summary of Hale’s Lactation Risk Categories
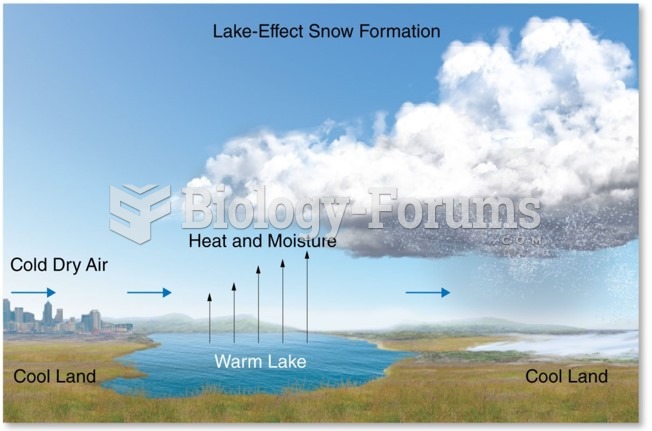 Distribution and Forms of Precipitation: Snow
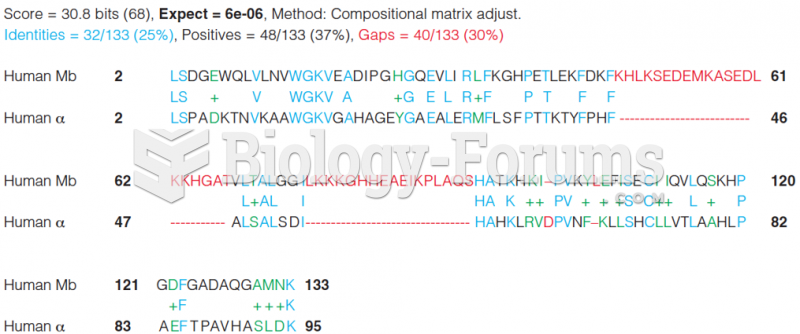 A BLAST alignment between human myoglobin and human a-globin showing a 25% sequence identity
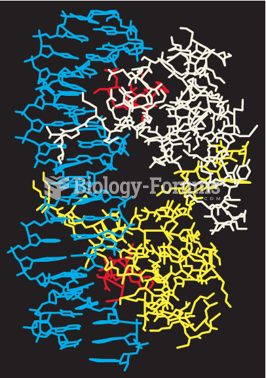 Structure of the l cI repressor-DNA complex showing the recognition helices (in red)
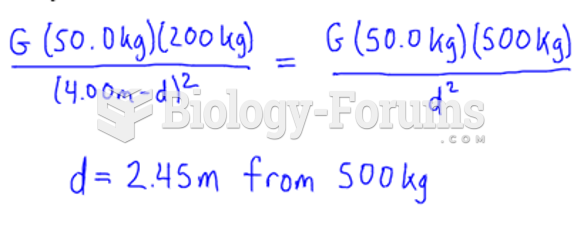 Gravitational Force Due to a Distribution of Mass problem 2
 Yanofsky’s cotransduction frequency analysis