This topic contains a solution. Click here to go to the answer
|
|
|

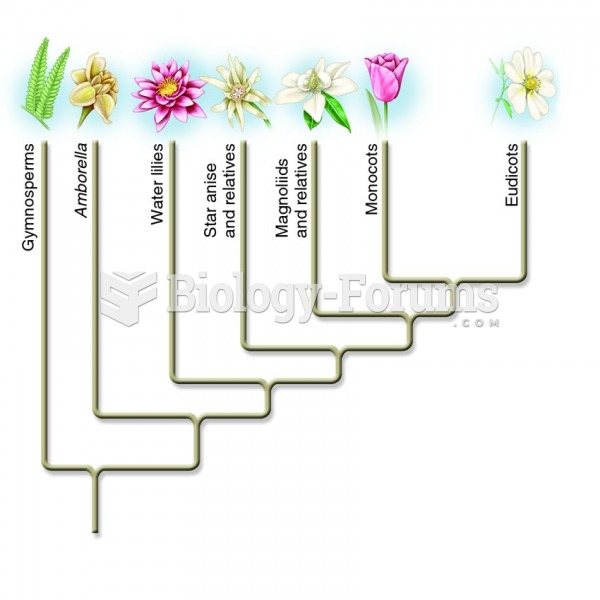 A phylogeny showing the major modern angiosperm lineages
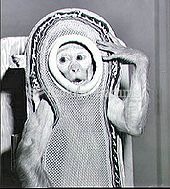 Sam, a rhesus macaque, was flown to a height of 55 miles (89 km) by NASA in 1959
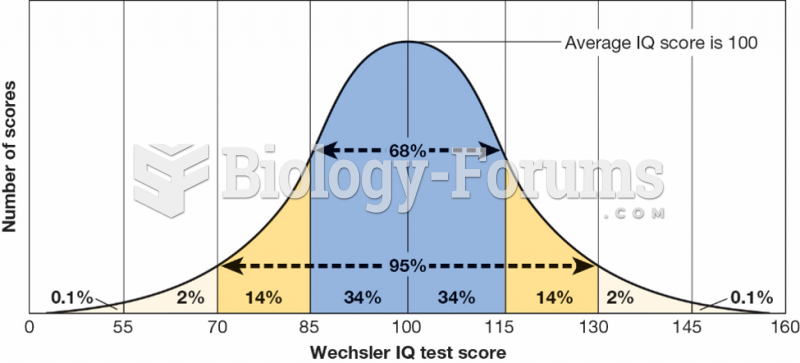 Normal Distribution of IQ Scores
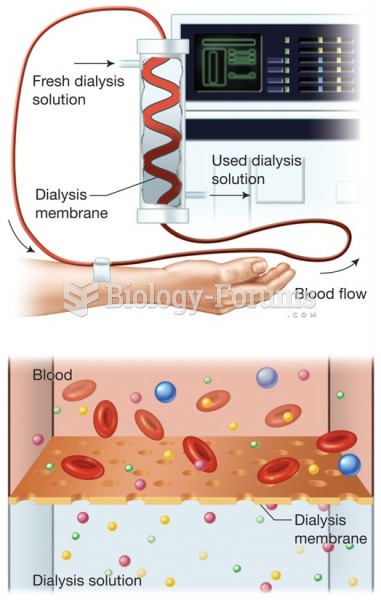 Dialysis machine showing diffusion of concentrations, which are the same, between the patient’s ...
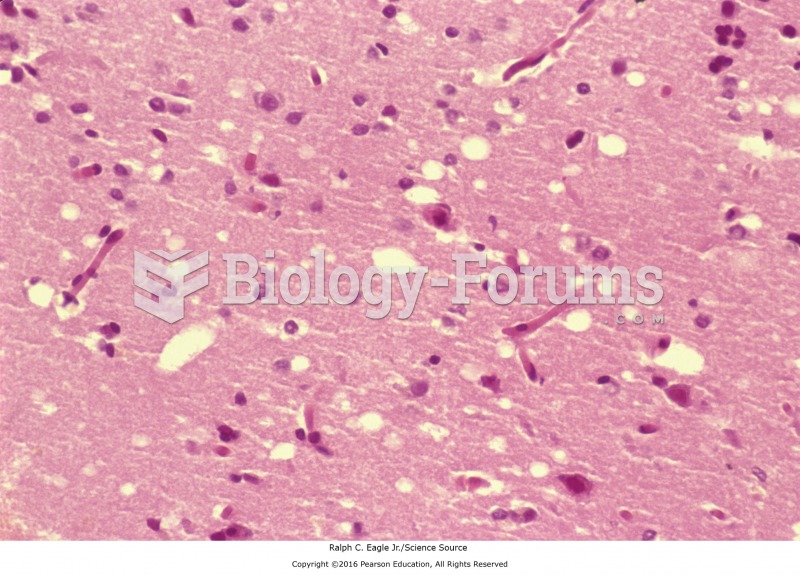 A histologic slide showing the sponge-like architecture of a patient with Creutzfeldt-Jakob Disease.
 If the frequency equals 60 Hz in Figure 10-1, what is the value of capacitance?