This topic contains a solution. Click here to go to the answer
|
|
|

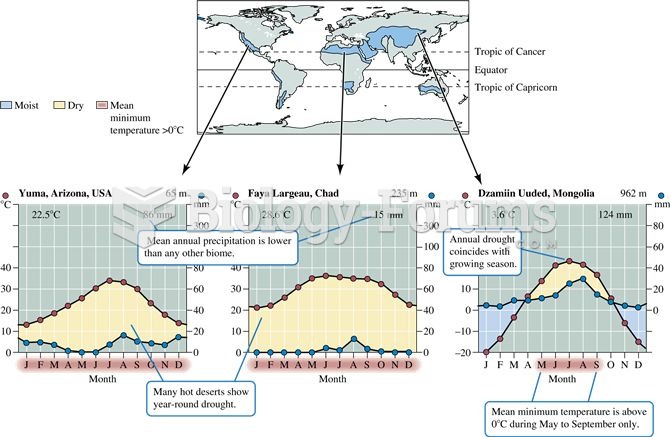 Desert distribution and climate
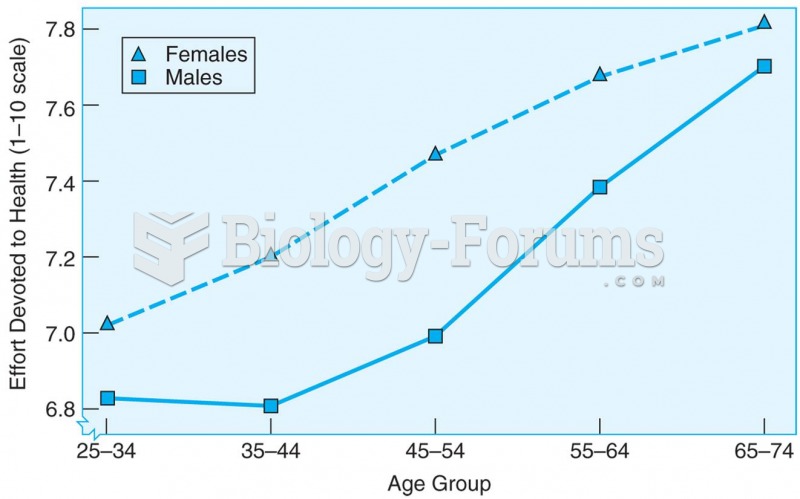 Cross-sectional data showing that the amount of effort spent on personal health care increases with
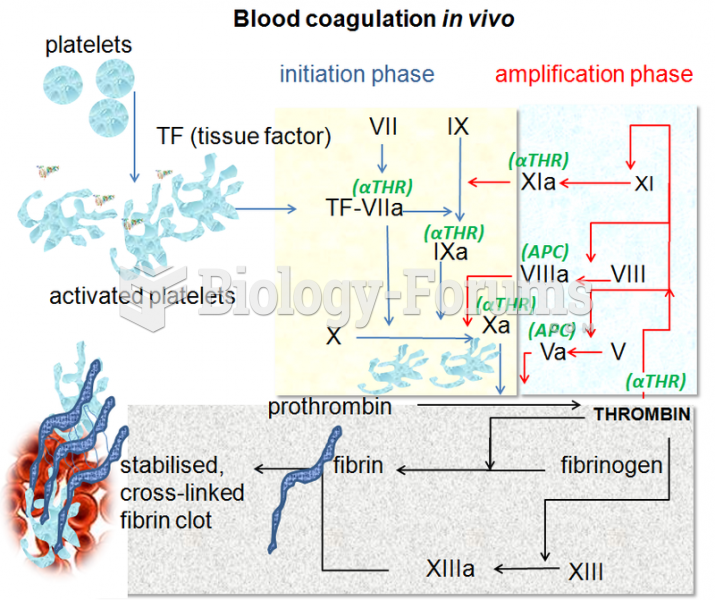 Blood coagulation pathways in vivo showing the central role played by thrombin
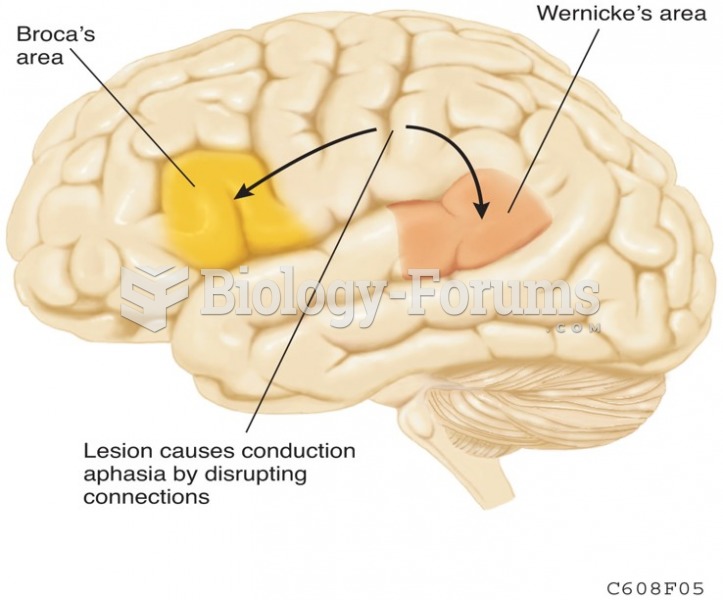 Diagram Showing How Conduction Aphasia is Caused
 The Distribution of Water on Earth
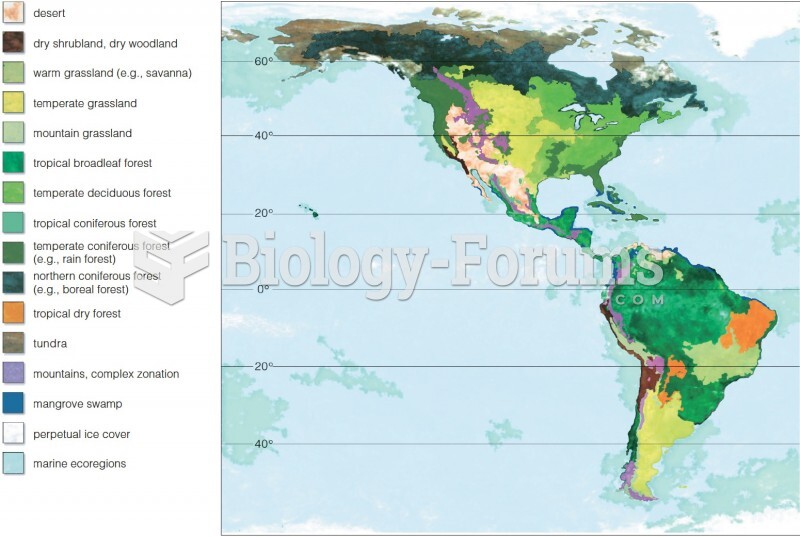 Global Distribution of Biomes