|
|
|

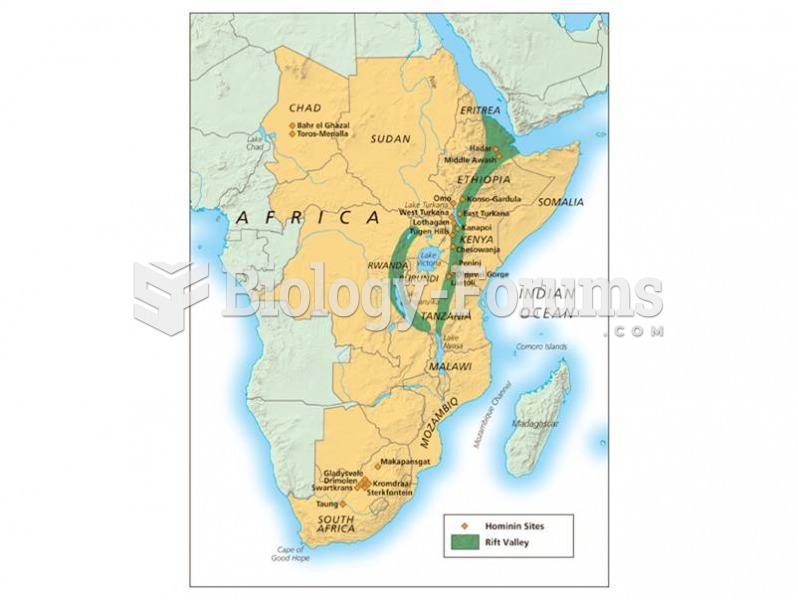 Geographic distribution of early hominins.
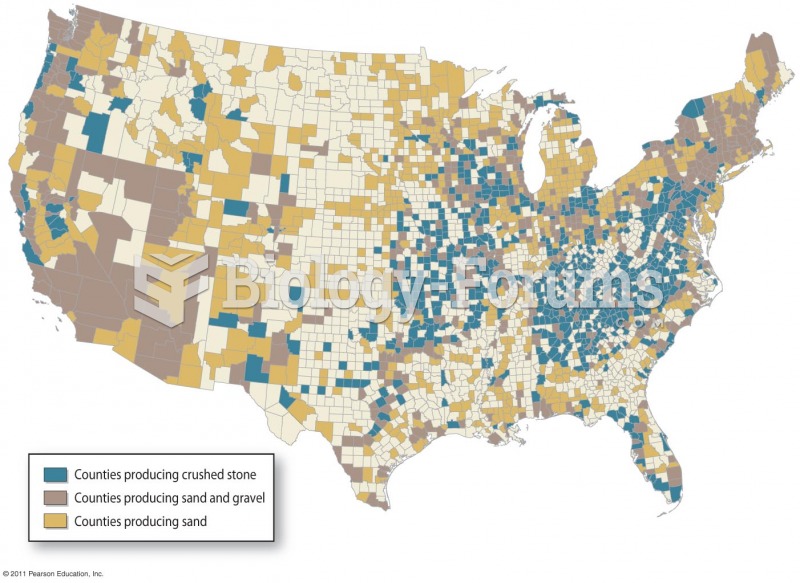 Distribution of Aggregate Mining
 This January 1937 photo from Sneedville, Tennessee, shows Eunice Johns, age 9, and her husband, ...
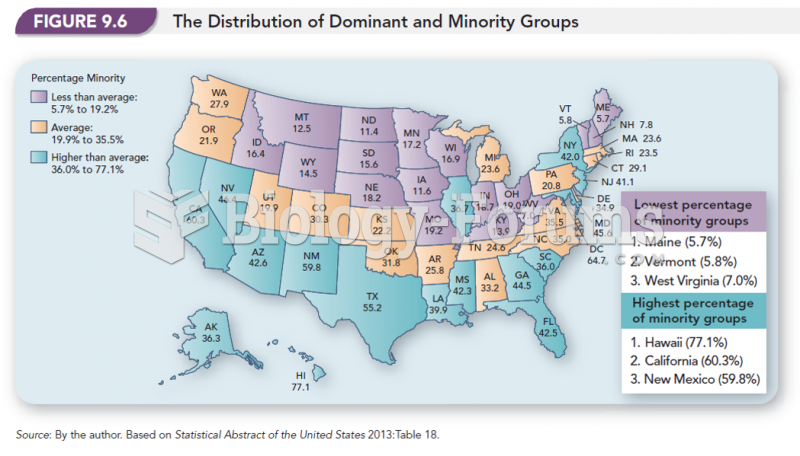 The Distribution of Dominant and Minority Groups
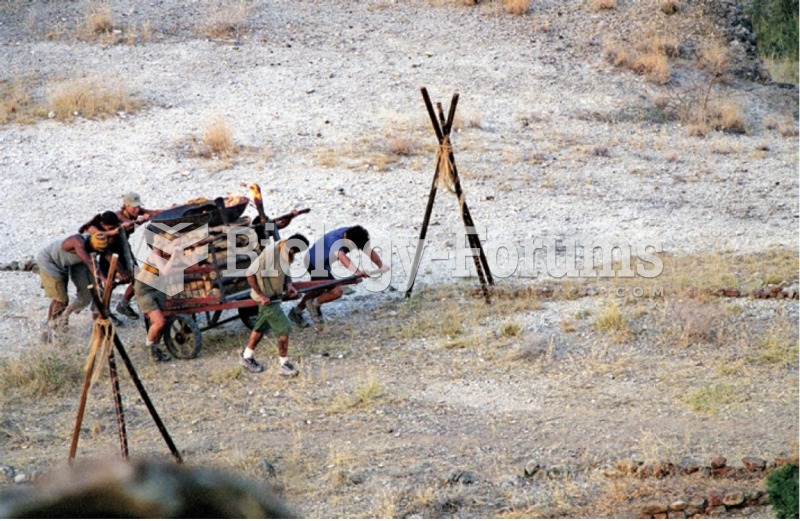 Are reality shows “real”? Does the media tell the “truth”?
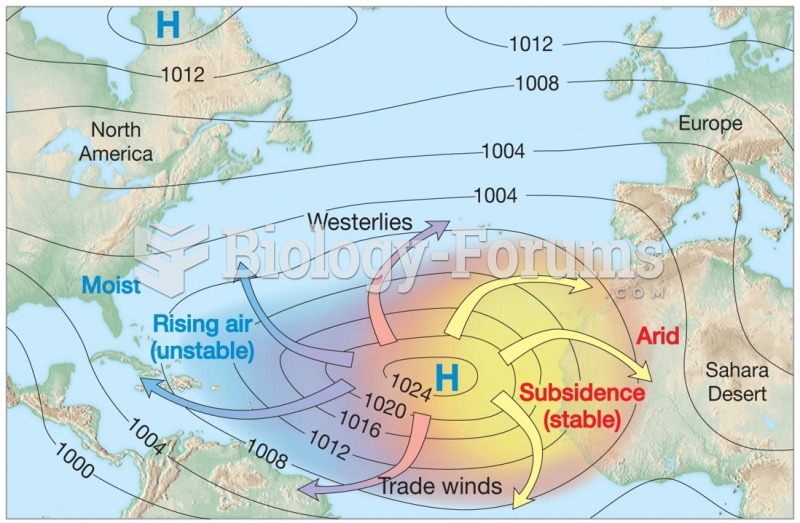 Distribution of precipitation over the continents