|
|
|

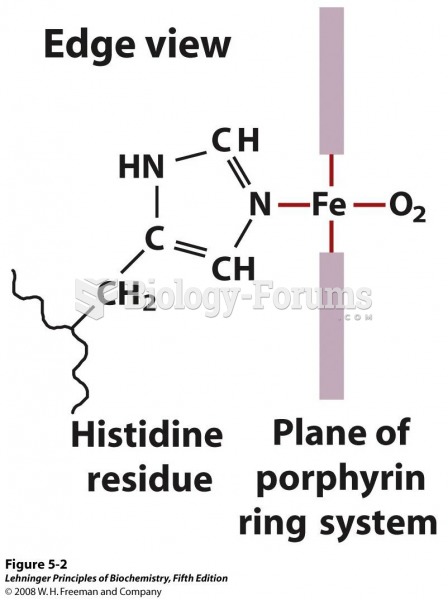 The heme group viewed from the side. This view shows the two coordination bonds to Fe2+
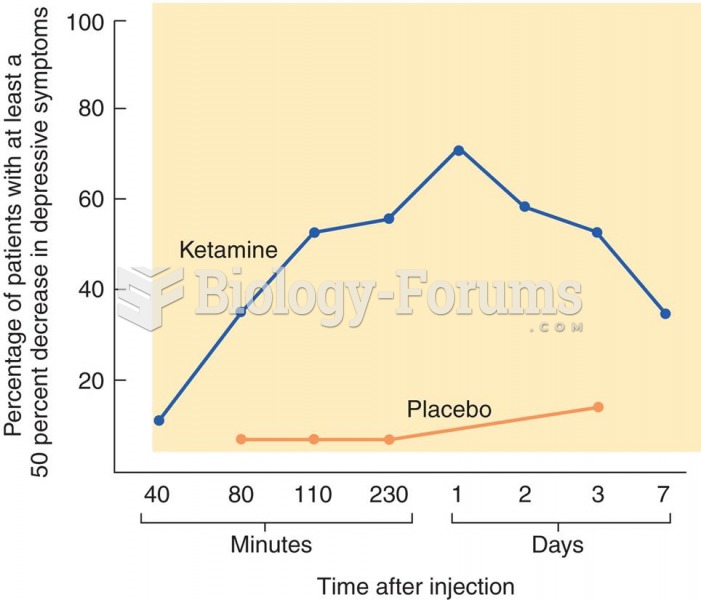 Treatment of Depression with Ketamine The graph shows the effects of ketamine on symptoms of depress
 Are reality shows “real”? Does the media tell the “truth”?
 Cumulative Standard Normal Distribution
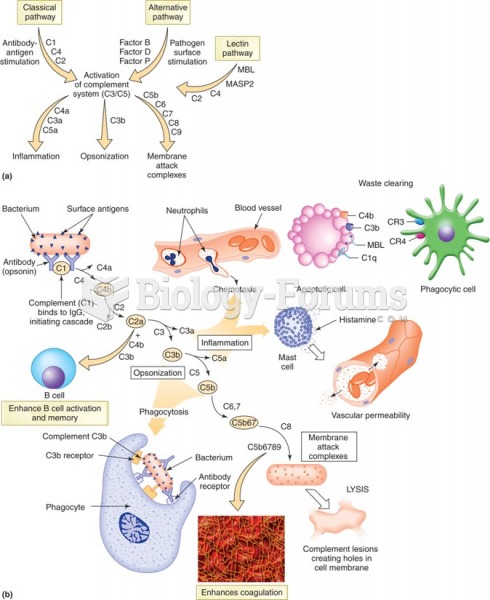 Three pathways of complement combined. (a) Figure shows a summary of how each pathway proceeds. (b) ...
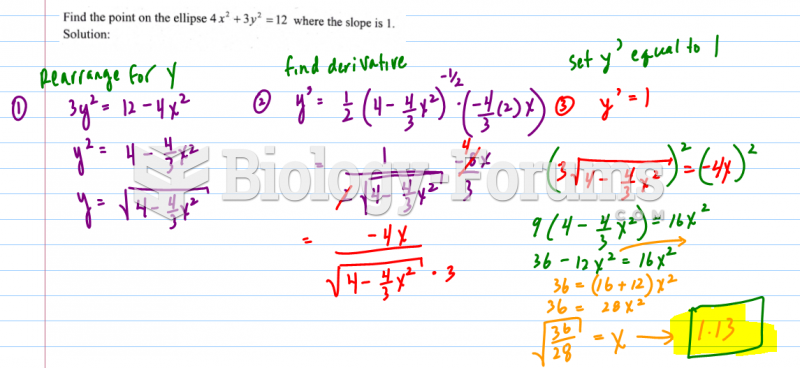 Derivative application problem