|
|
|

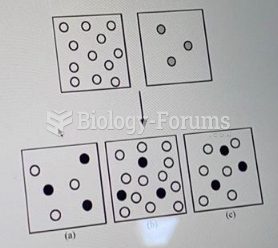
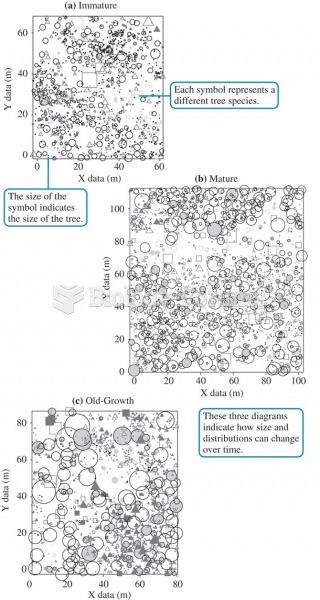 The spatial distribution of trees in three separate stands of different ages on Vancouver Island (da
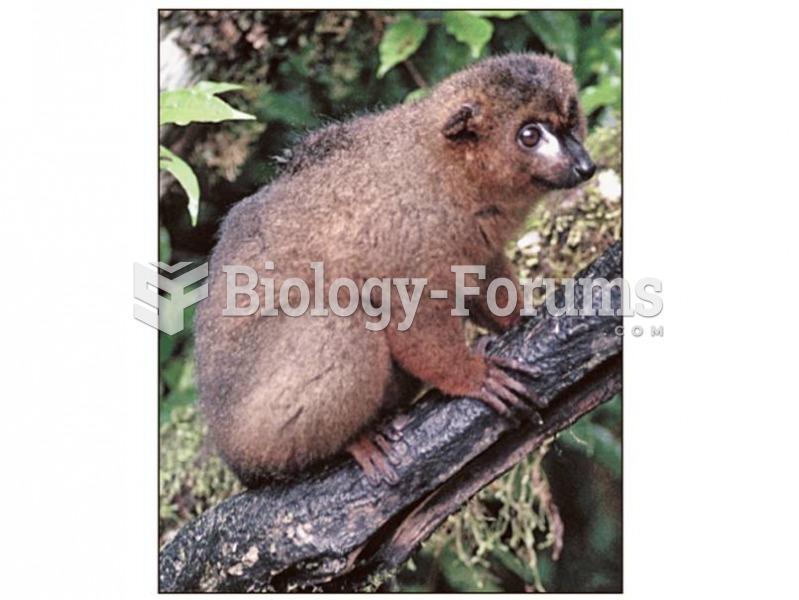 This red-bellied lemur shows clearly the traits that characterize strepsirhine primates.
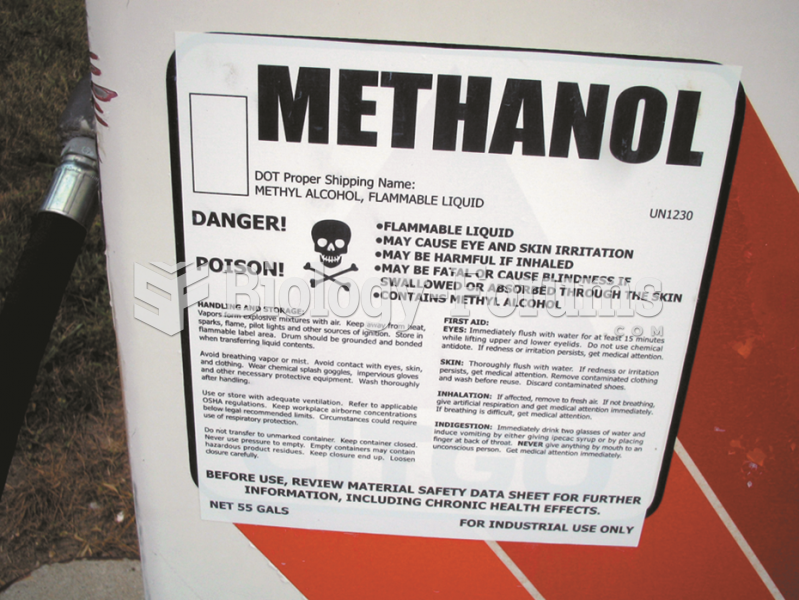 Sign on methanol pump shows that methyl alcohol is a poison and can cause skin irritation and other ...
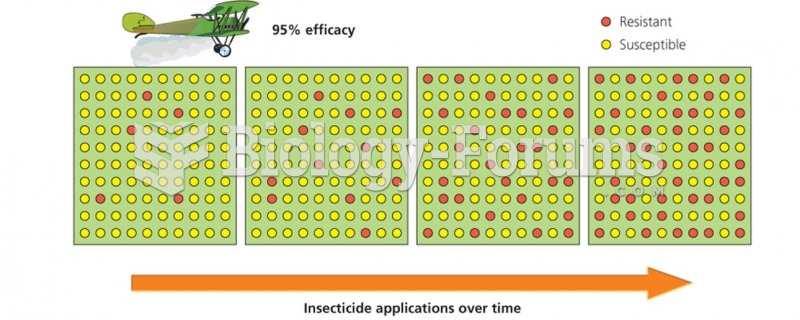 Insecticide application over time
 Which outcome corresponds to the reaction:H3AsO4 + 3 OH- → 3 H2O + AsO43-?
 Change in the frequency of a lethal recessive allele, a