|
|
|

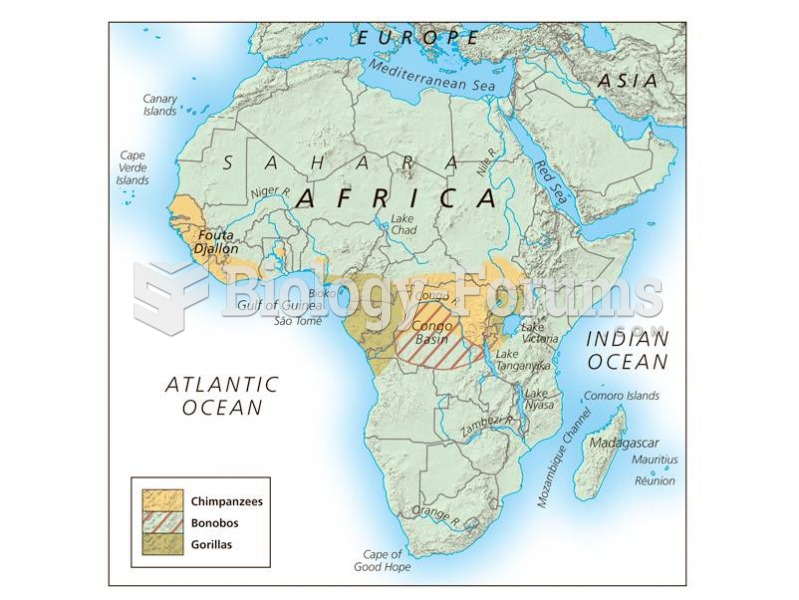 Distribution of the African great apes.
 The end of a typical line wrench, which shows that it is capable of grasping most of the head of ...
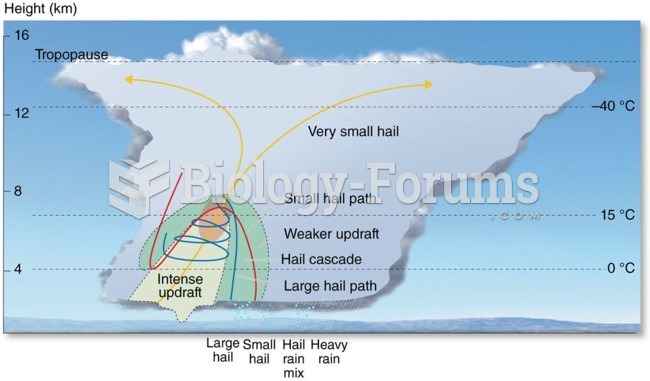 Distribution and Forms of Precipitation: Graupel and Hail
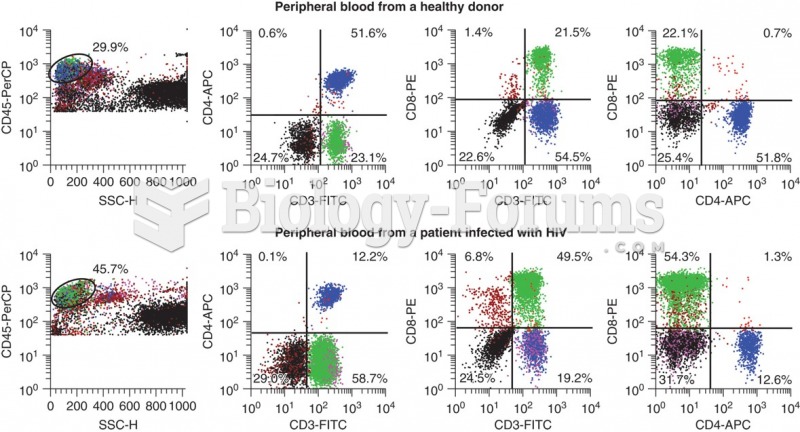 Flow cytometry data that shows the differences in CD3+ CD4+ cells that occur with HIV infection. ...
 Construct a Lorenz curve that shows income distribution in this society.
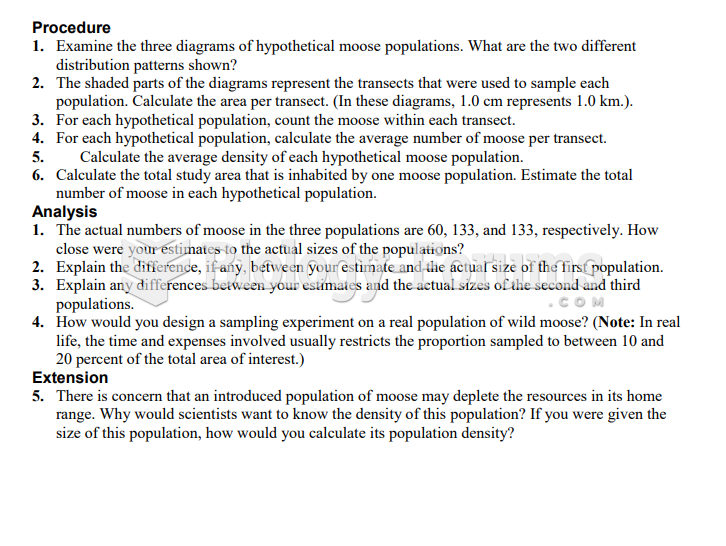 Distribution Patterns and Population Size Estimates (Bio 30)