|
|
|

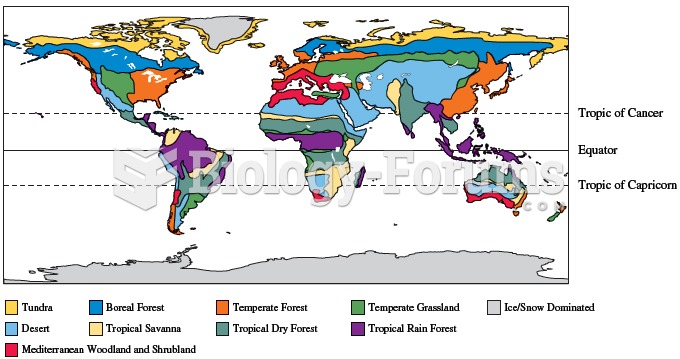 Variation in climatic conditions result in geographic variation in the distribution of biome types a
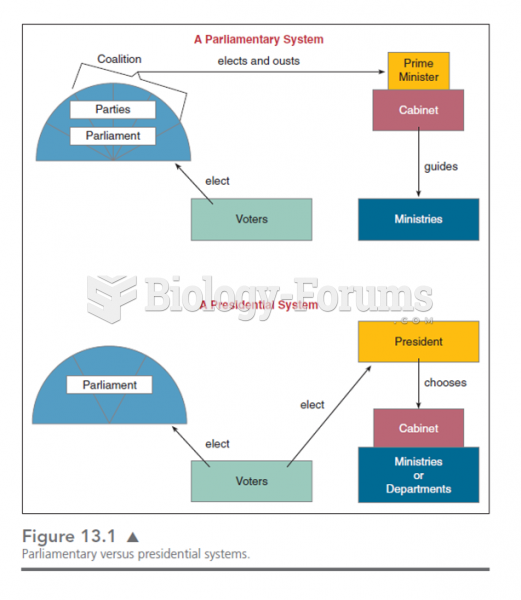 This chart shows the various lines of responsibility and how they differ in presidential and parliam
 Demonstrate the Application of Triangular, Figure-Eight, and Tubular Bandages
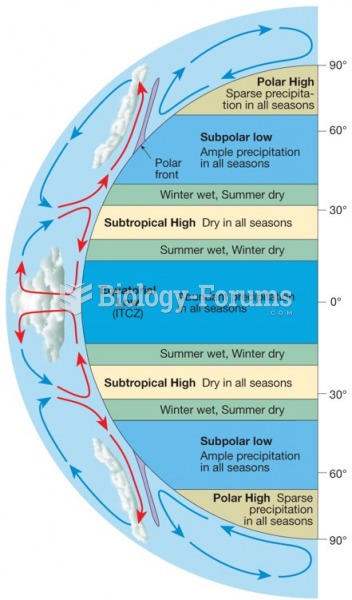 Global Distribution of Precipitation
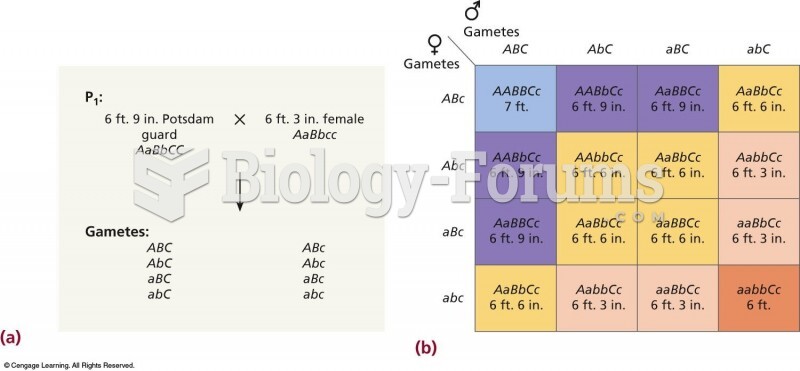 An additive model for the inheritance of height in the Potsdam Guards. In this example, the guards a
 A melting profile shows the increase in UV absorption versus temperature