This topic contains a solution. Click here to go to the answer
|
|
|

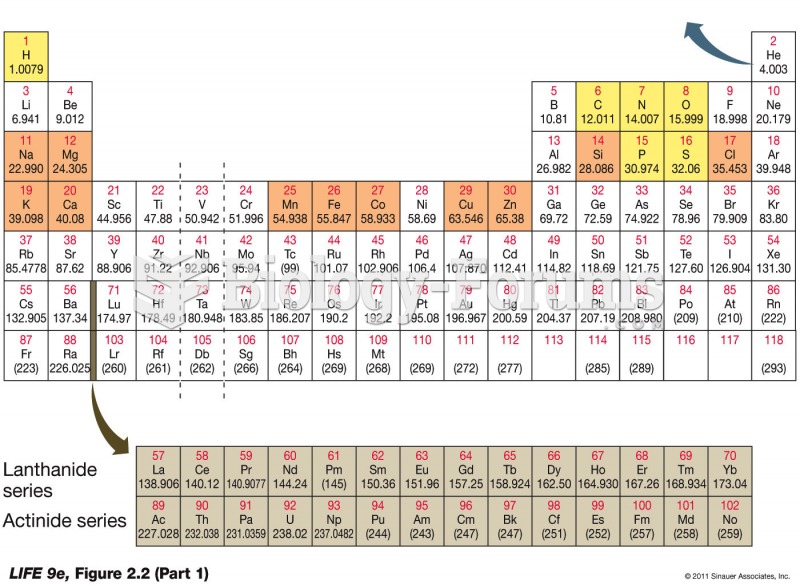 The Periodic Table (Part 1)
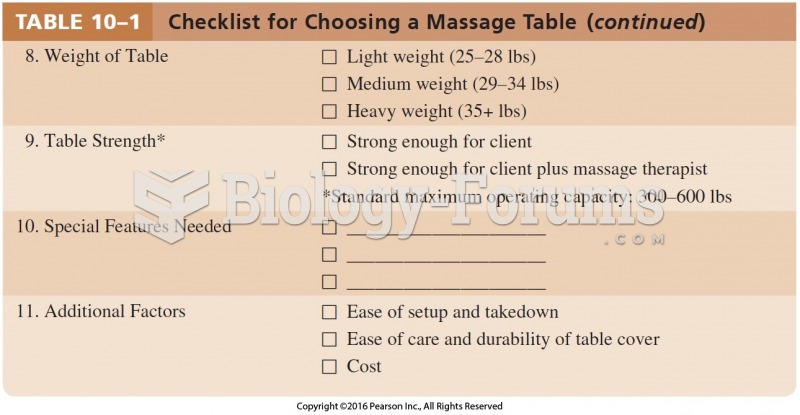 Checklist for Choosing a Massage Table Cont.
 Assistance in getting off the massage table.
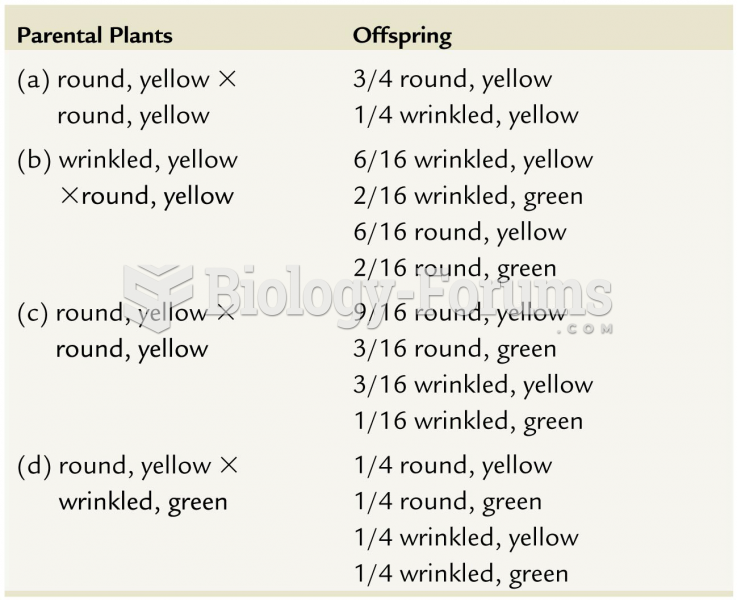 Table showing comparing between Parental Plants vs. Offspring
 A sample of 400 observations will be taken from an infinite population. The population ...
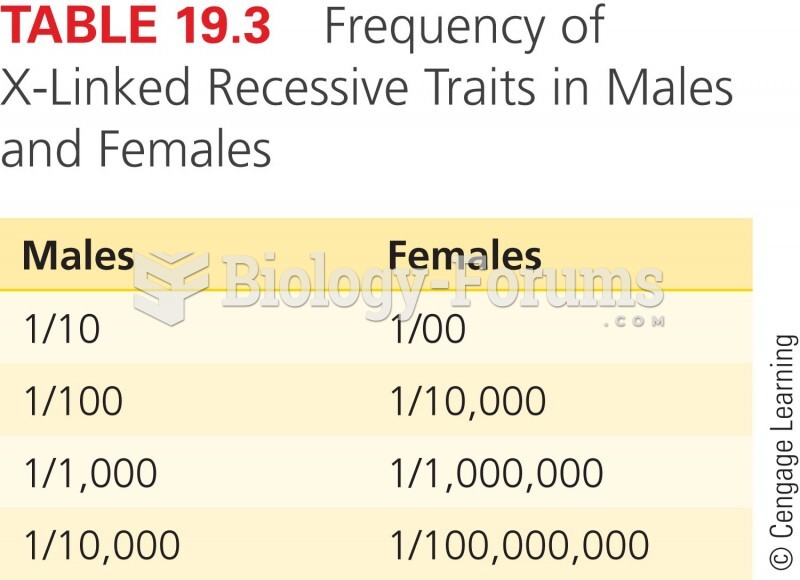 Frequency of X-Linked Recessive Traits in Males and Females