This topic contains a solution. Click here to go to the answer
|
|
|

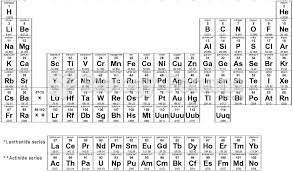 Periodic Table
 Frank Lloyd Wright, Table lamp, executed for the Linden Glass Co. for the Susan Lawrence Dana ...
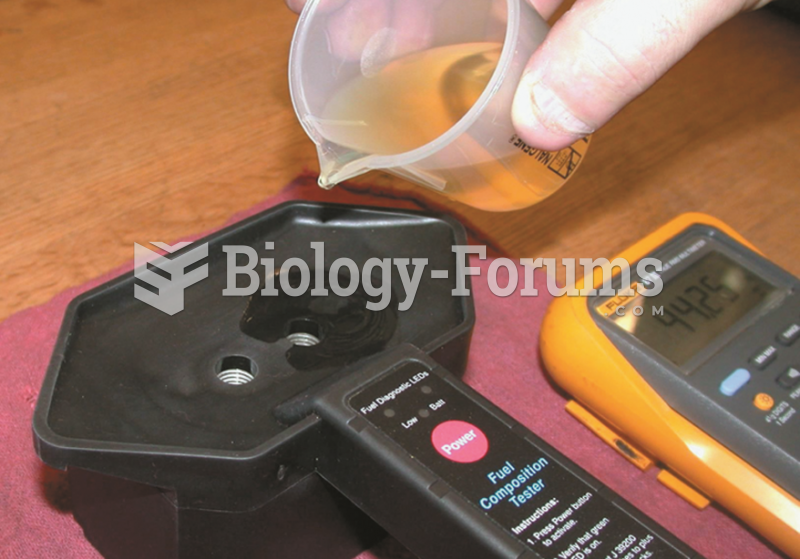 After verifying that the tester is capable of correctly reading the air frequency, gasoline is ...
 table
table
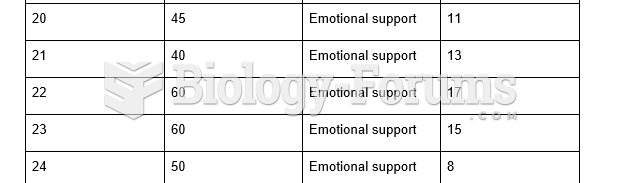 APA Table - SPSS
 Hardy–Weinberg Mating Table for Two Alleles of an Autosomal Gene