This topic contains a solution. Click here to go to the answer
|
|
|

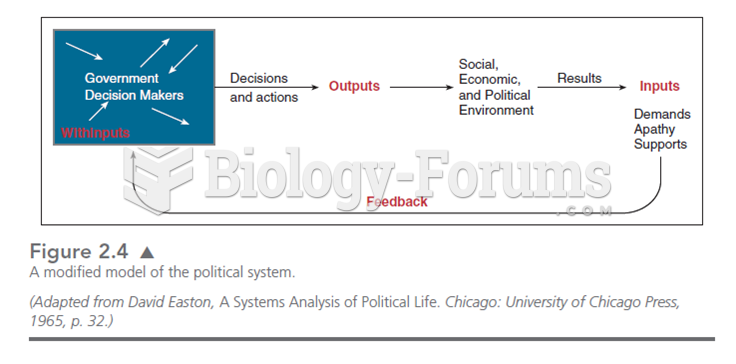 This modified model of Easton’s systems theory puts government decision makers as the source of pol
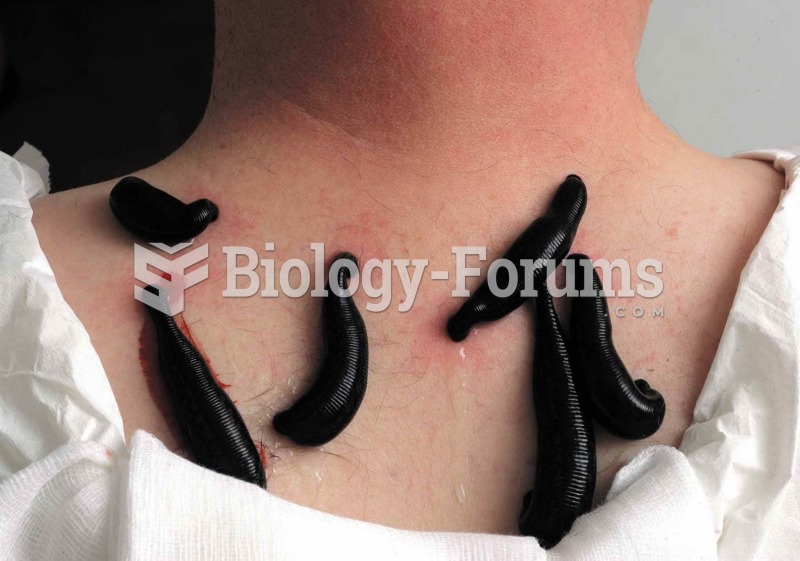 Medicinal leeches on a patient’s neck. Today leeches are sometimes used in microsurgery to prevent b
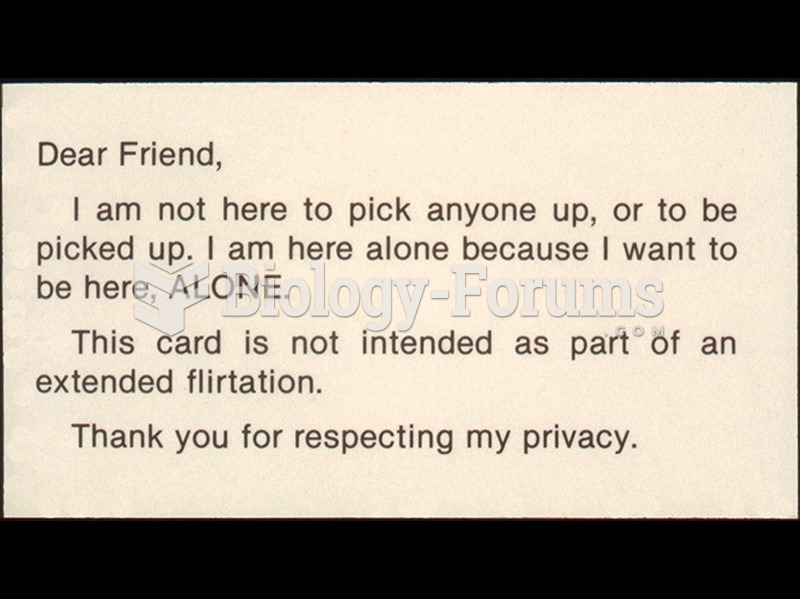 Adrian Piper, My Calling (Card) #2 (for Bars and Discos).
 A pharmacist can explain to a patient why medication may look different and ensure the correct ...
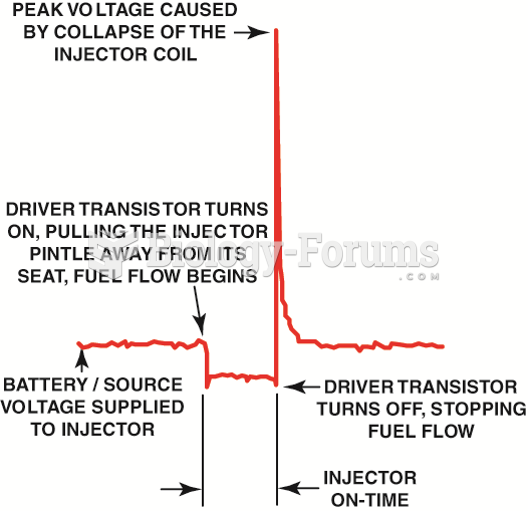 The injector on-time is called the pulse width.
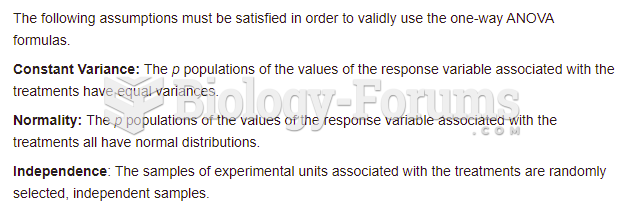 Explain the assumptions that must be satisfied in order to validly use the one-way ANOVA ...