This topic contains a solution. Click here to go to the answer
|
|
|

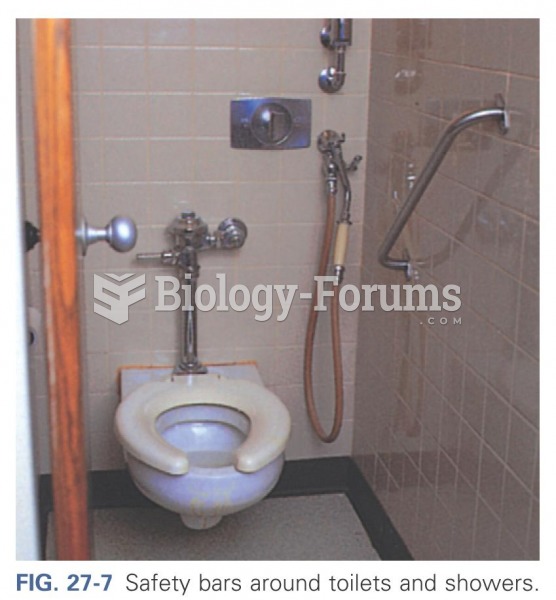 Safety bars around toilets
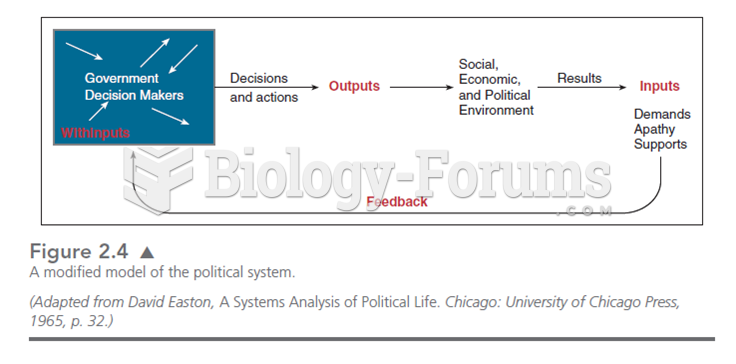 This modified model of Easton’s systems theory puts government decision makers as the source of pol
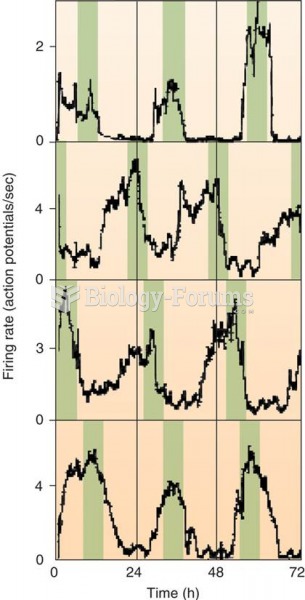 Firing Rate of Individual SCN Neurons in a Tissue Culture Color bars have been added to emphasize th
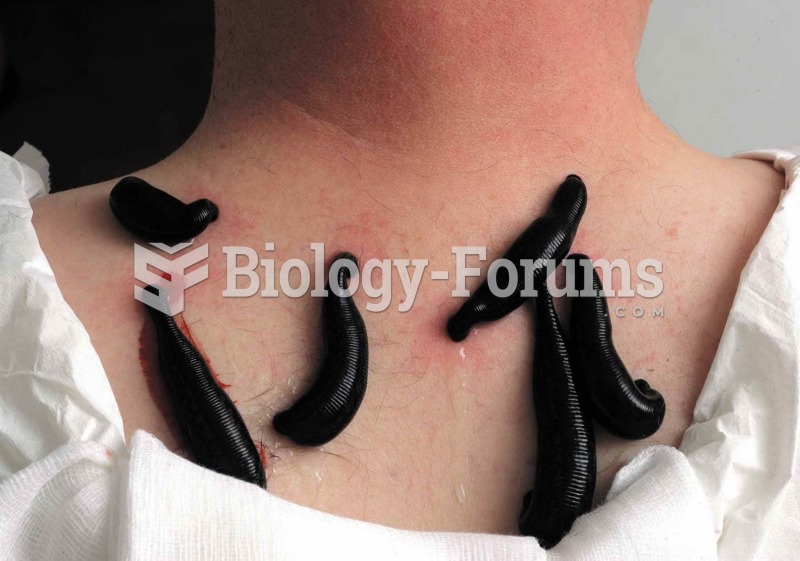 Medicinal leeches on a patient’s neck. Today leeches are sometimes used in microsurgery to prevent b
 An overlapping record extends back thousands of years of tree ring width
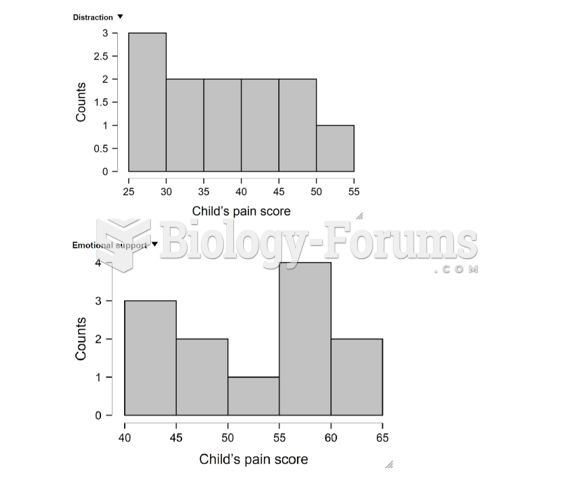 Histogram