The graph of a discrete random variable looks like a histogram where the probability of each possible outcome is represented by a bar.
Indicate whether the statement is true or false
Question 2
Which of the following is a key difference between a bar chart and a histogram?
A) A bar chart typically has gaps between the bars while a histogram has no gaps.
B) A bar chart is developed to analyze a continuous variable, while a histogram is used to analyze discrete variables.
C) Both A and B are correct.
D) There is actually no real difference between a bar chart and a histogram.

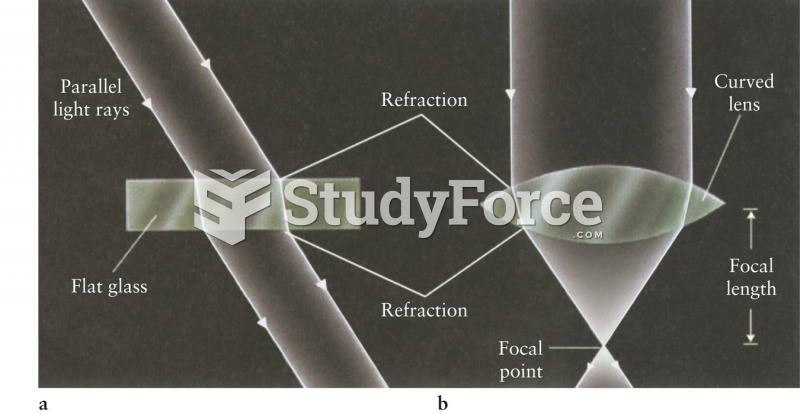 Refraction Through Uniform and Variable Thickness Glasses
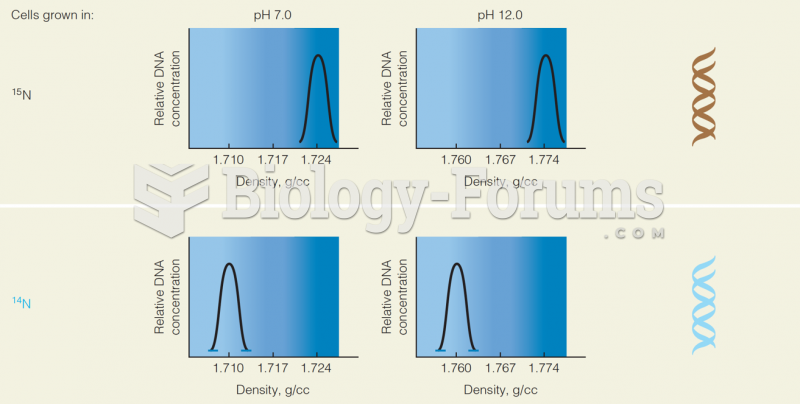 Cell Grown in 15N and 14 N: Graph of Relative DNA Concentration Vs. the Density
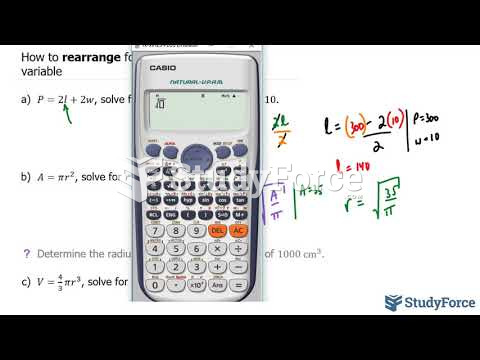 How to rearrange formulas to isolate for a variable
 Sketch a graph of the function h(x), by hand on the following interval:
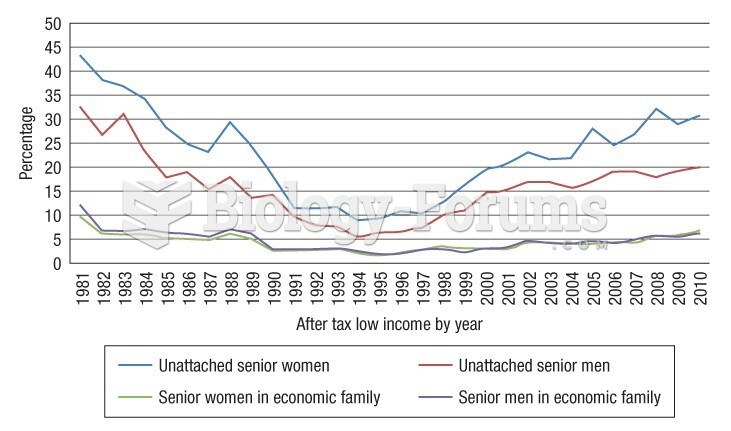 This graph illustrates how unattached older adults are poorer than their peers who live in families
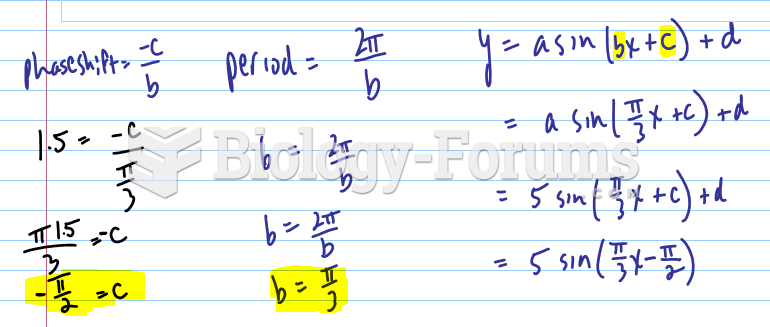
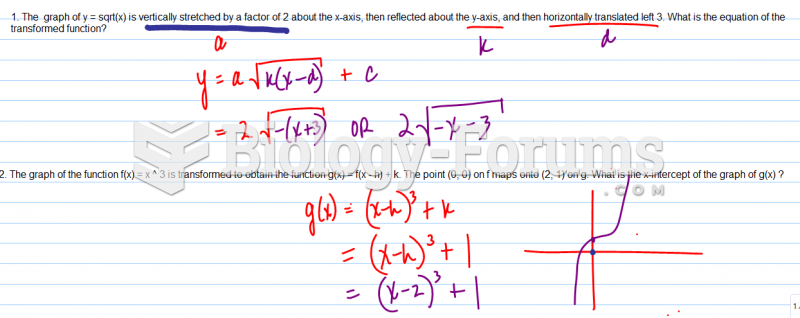 The graph of y = sqrt(x) is vertically stretched by a factor