The graph of a discrete random variable looks like a histogram where the probability of each possible outcome is represented by a bar.
Indicate whether the statement is true or false
Question 2
Which of the following is a key difference between a bar chart and a histogram?
A) A bar chart typically has gaps between the bars while a histogram has no gaps.
B) A bar chart is developed to analyze a continuous variable, while a histogram is used to analyze discrete variables.
C) Both A and B are correct.
D) There is actually no real difference between a bar chart and a histogram.

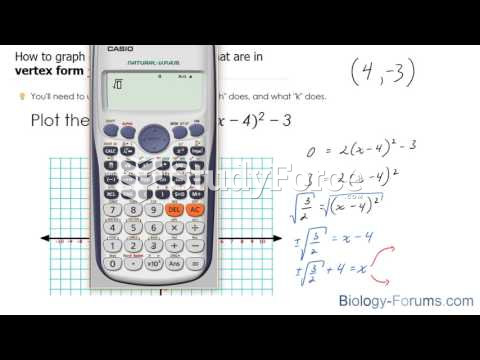 How to graph quadratic equations that are in vertex form
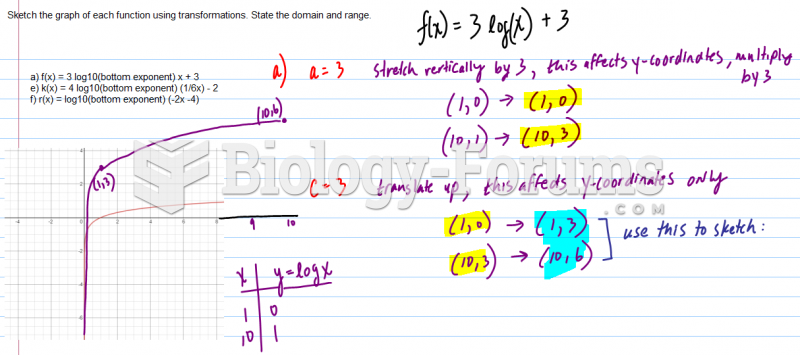 Sketch the graph of each function using transformations. State the domain and range.
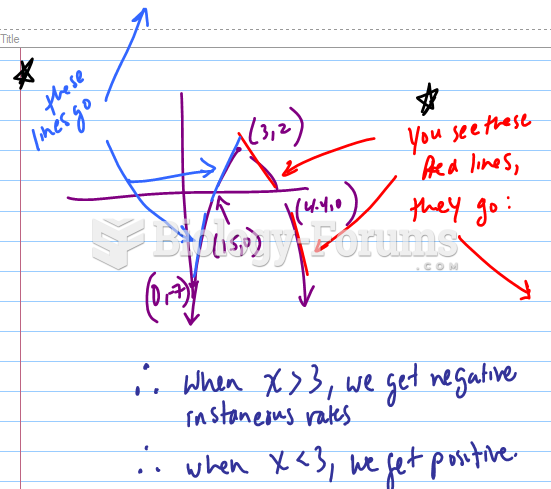 If a graph has the following x-intercepts, which value of x is the instantaneous rate of change ...
 A random sample of 87 airline pilots recruited by an airline service had an average yearly ...
 Calculation of Joint Probability of a Genotype Based on Seven CODIS STR Markers
 Random X inactivation in female placental mammals