In situations involving two or more variables, both histograms and bar charts can be used for multiple variables on the same graph.
Indicate whether the statement is true or false
Question 2
A cell phone service provider has selected a random sample of 20 of its customers in an effort to estimate the mean number of minutes used per day.
The results of the sample included a sample mean of 34.5 minutes and a sample standard deviation equal to 11.5 minutes. Based on this information, and using a 95 percent confidence level:
A) the critical value is z = 1.96
B) the critical value is z = 1.645
C) the critical value is t = 2.093
D) The critical value can't be determined without knowing the margin of error.

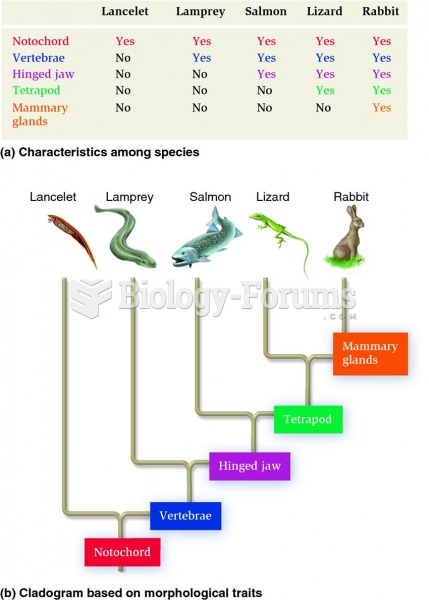 Ancestral versus shared derived characters involving morphological traits.
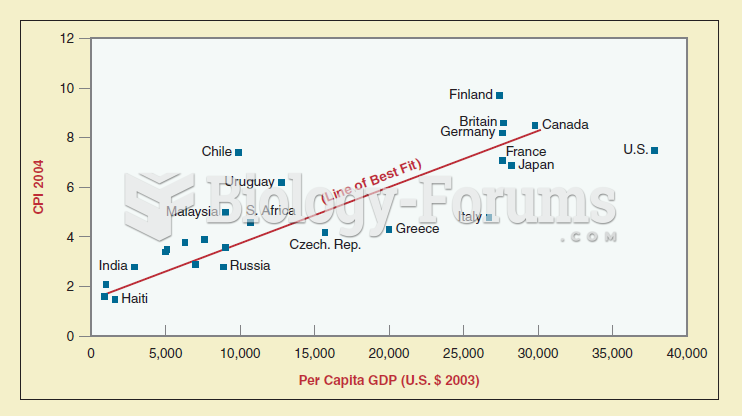 Scattergrams are a mechanism used by political scientists to show patterns and relationships among v
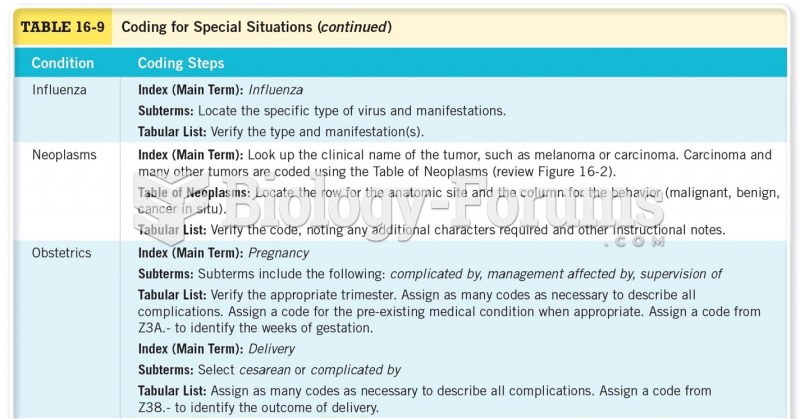 Coding for Special Situations Cont
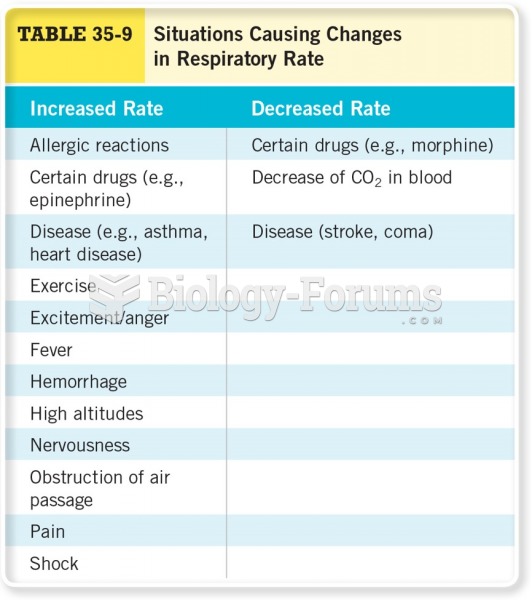 Situations Causing Changes in Respiratory Rate
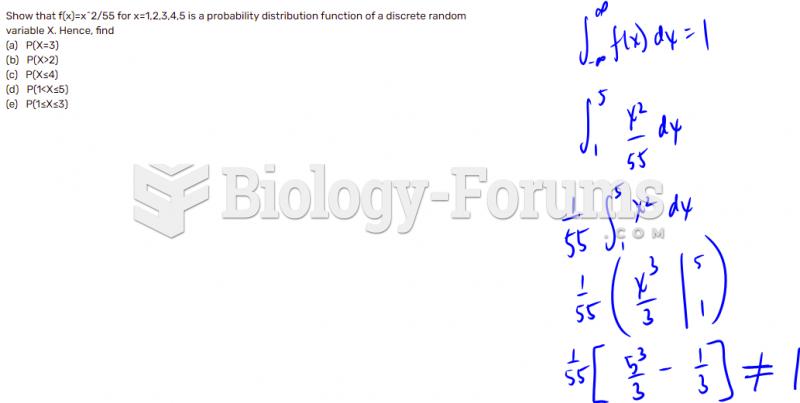 Discrete random variables- Probability Distribution Function
 Histograms