In situations involving two or more variables, both histograms and bar charts can be used for multiple variables on the same graph.
Indicate whether the statement is true or false
Question 2
A cell phone service provider has selected a random sample of 20 of its customers in an effort to estimate the mean number of minutes used per day.
The results of the sample included a sample mean of 34.5 minutes and a sample standard deviation equal to 11.5 minutes. Based on this information, and using a 95 percent confidence level:
A) the critical value is z = 1.96
B) the critical value is z = 1.645
C) the critical value is t = 2.093
D) The critical value can't be determined without knowing the margin of error.

 Everyday situations sometimes present opportunities for children to build information processing ...
 How to solve inequalities involving absolute values (Part 2)
 How to solve problems involving the area of a rectangle
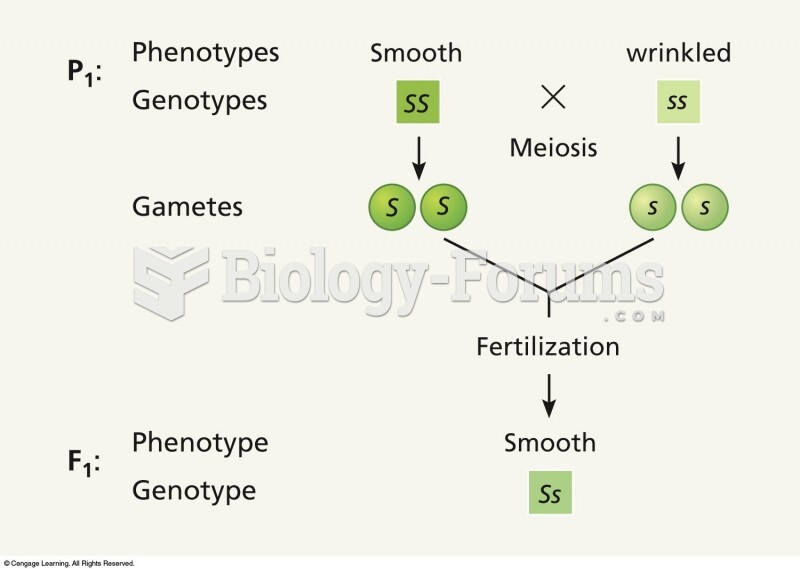 The phenotypes and genotypes of the parents (P1) and the offspring (F1) in a cross involving seed sh
 Uniparental disomy can be produced by several mechanisms involving nondisjunction in meiosis, nondis
 Histograms