|
|
|

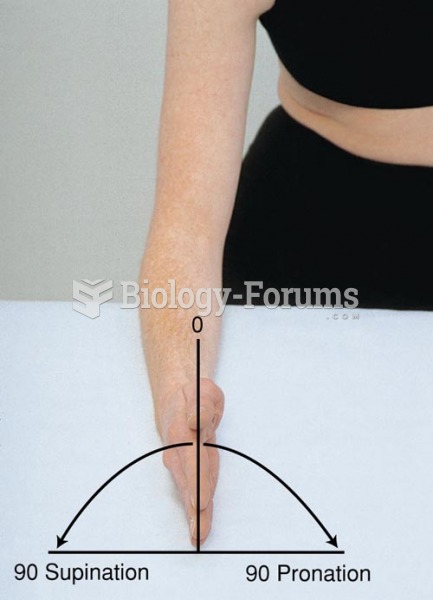 Range of Motion of the Elbow Joint, Supination, Pronation
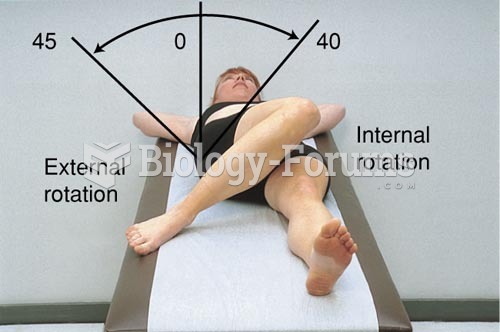 Range of Motion of the Hip Joint, Internal and External Rotation
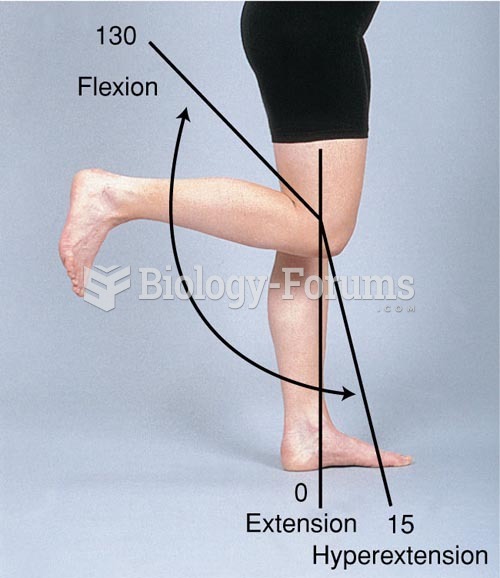 Range of Motion of the Knee Joint: Flexion, Extension, and Hyperextension
 Data Used to Analyze Productivity in Country 1 and Country 2
 A 16-input multiplexer is to be used to perform parallel-to-serial data conversion. Which of ...
 Ribosome structure and tRNA-binding sites interpreted from cryo-EM–generated data