|
|
|

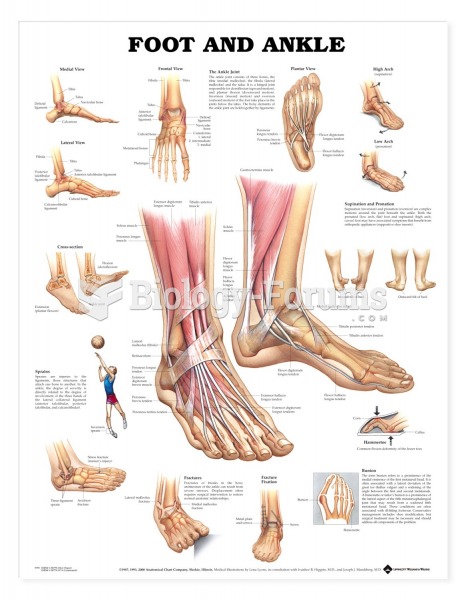 Anatomical Charts Foot and Ankle
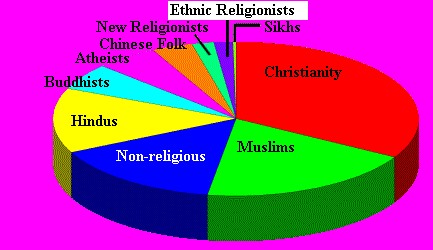 pie chart of the World's Religions
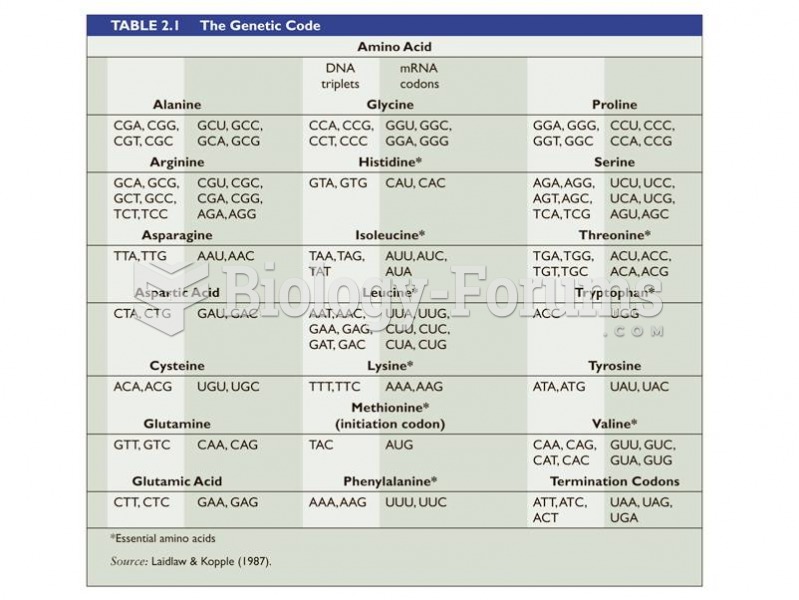 Amino acids chart
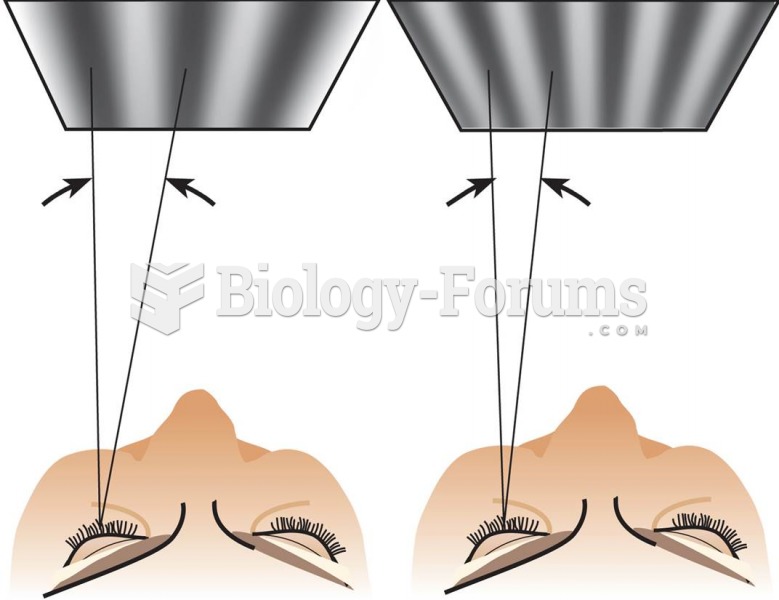 Visual Angle and Spatial Frequency
 An example of a corrected chart notation.
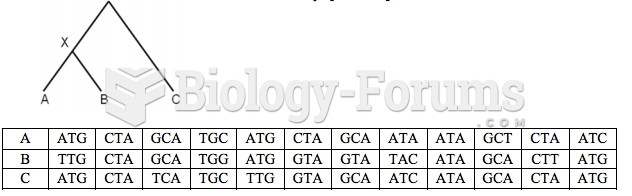 Outgroup role in relative rate test
|
|
|
Anatomical Charts Foot and Ankle
pie chart of the World's Religions
Amino acids chart
Visual Angle and Spatial Frequency
An example of a corrected chart notation.
Outgroup role in relative rate test
For a complete list of videos, visit our video library