|
|
|

 Blocked at every turn by congressional Republicans who hated him, President Obama turned to techniqu
 Three days after the Boston Marathon explosion, the FBI released this photograph that had been taken
 Indicators of Relative Economic Well-Being
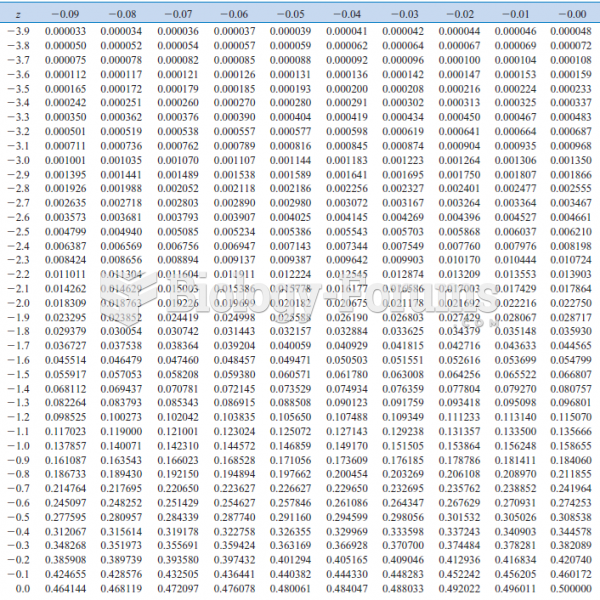 Cumulative Standard Normal Distribution
 Risk & Aseptic Processing - RABs Filling Line
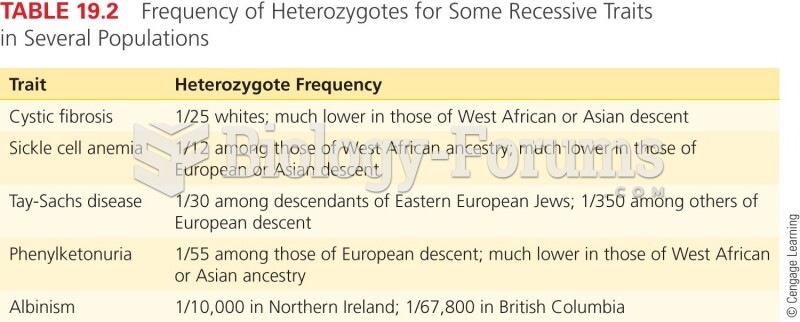 Frequency of Heterozygotes for Some Recessive Traits in Several Populations