|
|
|

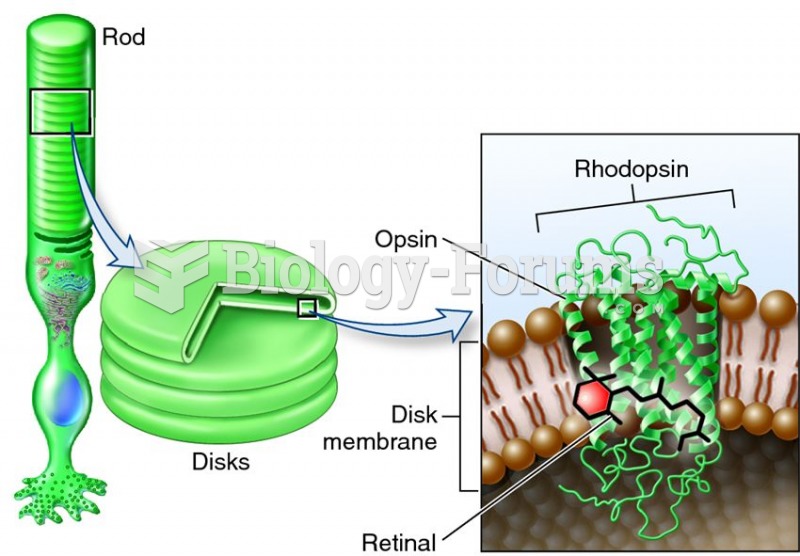 A visual pigment.
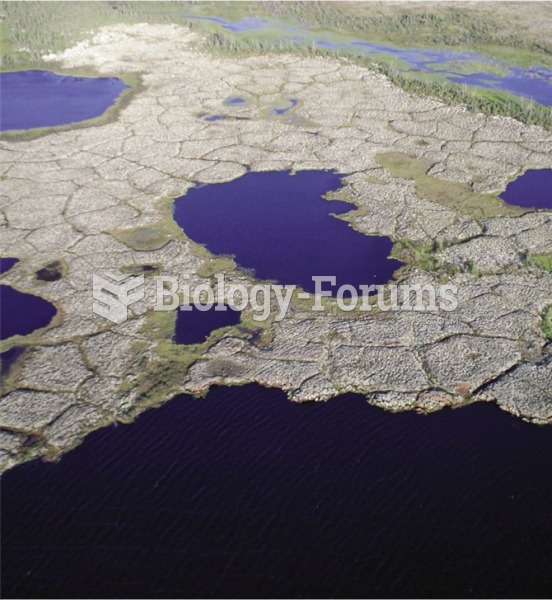 Ice-wedges form netlike polygons on the surface of the tundra, aerial photo of polygonal peat platea
 Instructions for Completing the CMS-1500 (02/12) Claim Form Continued
 Bank reconciliation form.
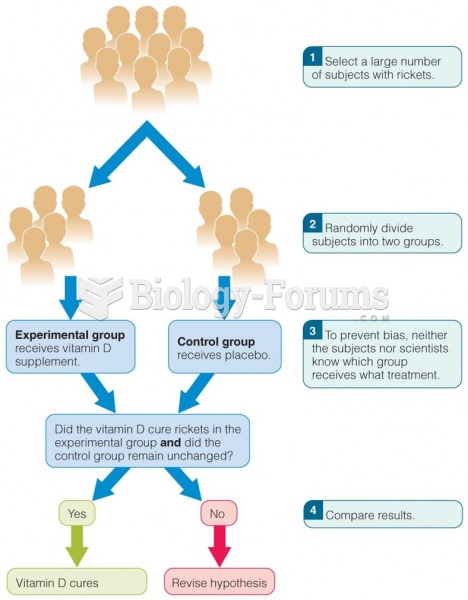 Controlled Scientific Experiments Scientists use experimental research to test hypotheses
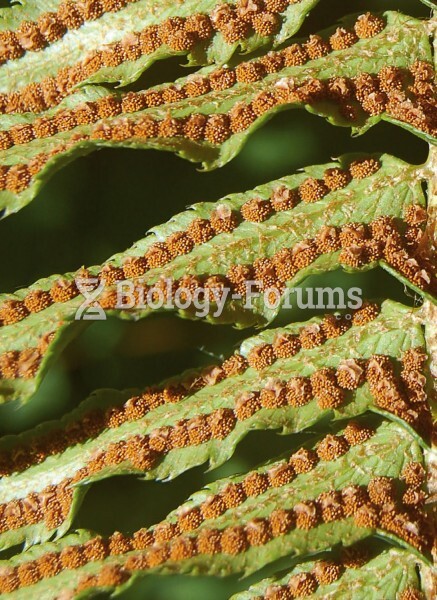 Ferns disperse by releasing spores that form on the underside of leaves.