This topic contains a solution. Click here to go to the answer
|
|
|

 The physician will begin visual inspection of the patient immediately upon entering the examination ...
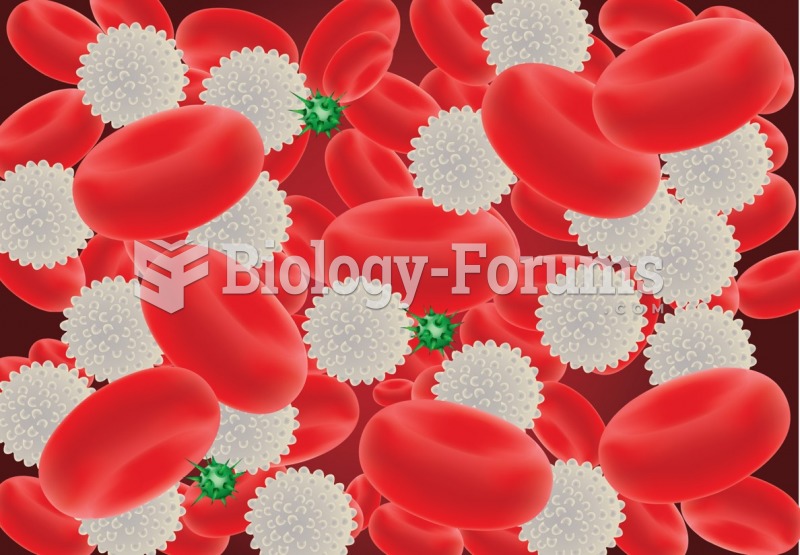 The formed elements: In this image, the red cells are red, the white cells are white, and the ...
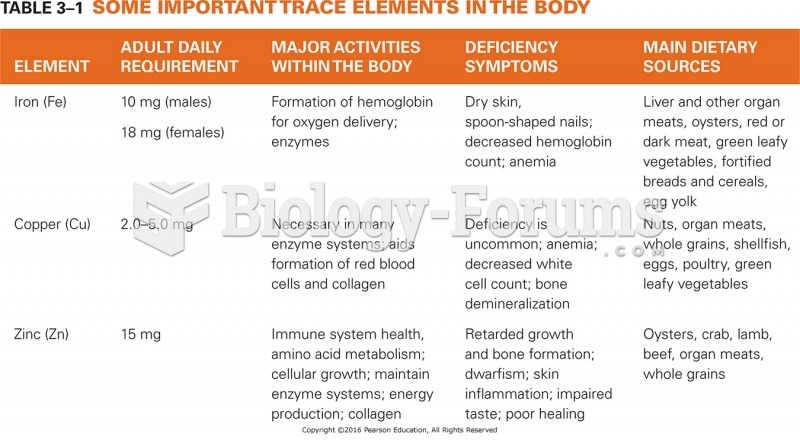 Important Trace Elements in the Body
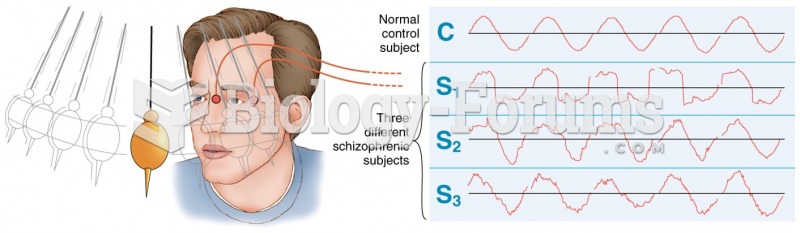 Visual tracking of a pendulum by a normal control subject (top) and three schizophrenics. (Adapted ...
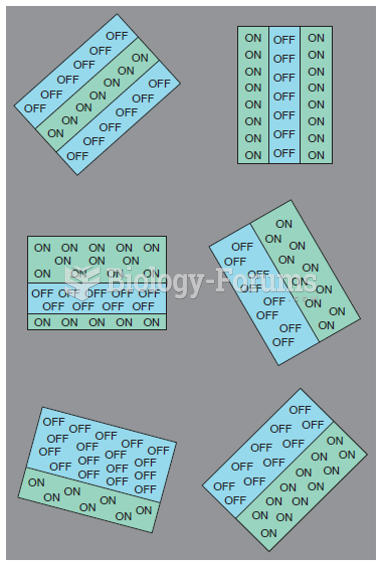 Examples of visual fields of simple cortical cells.
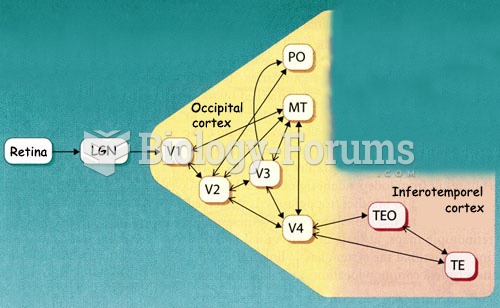 Lateral Geniculate (Visual Pathway)