This topic contains a solution. Click here to go to the answer
|
|
|

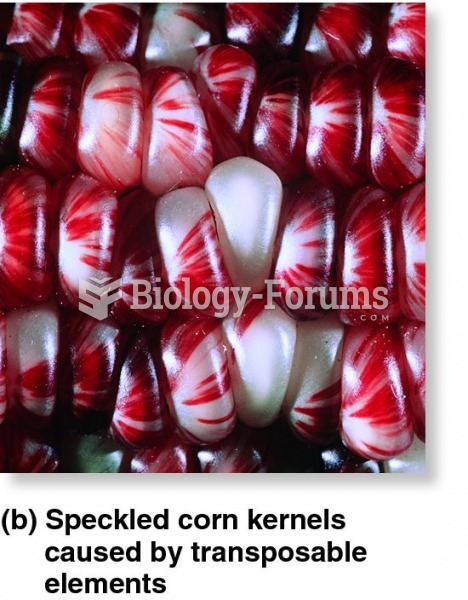 Transposable elements
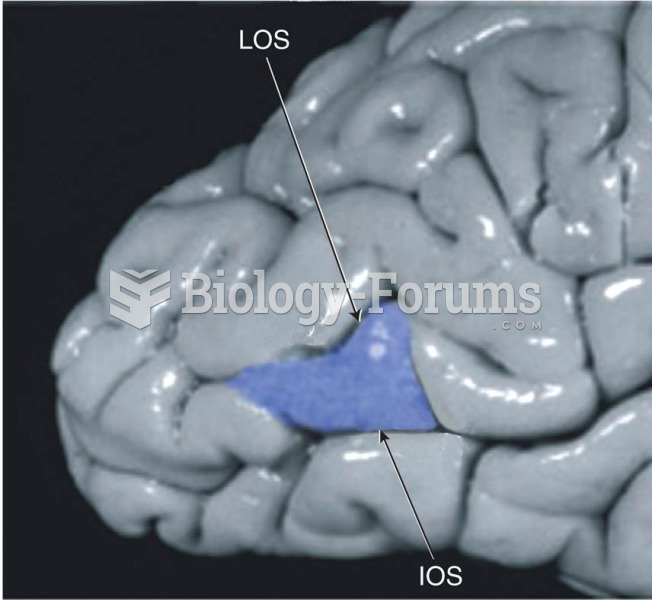 The Location of Visual Area V5
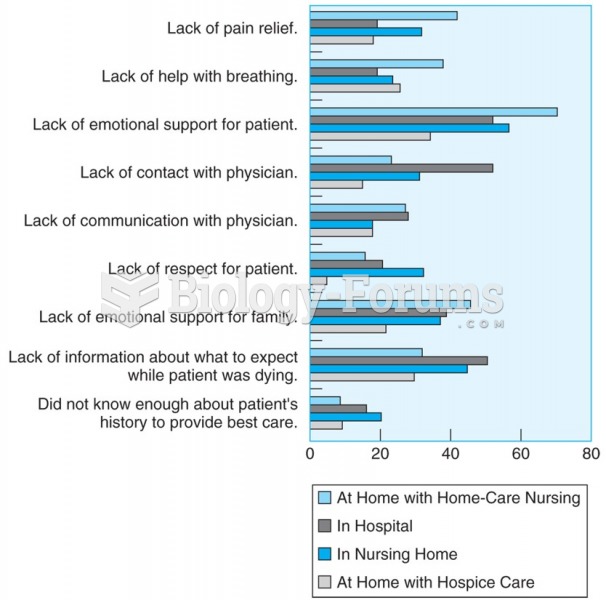 After the death of a loved one, family members report concerns about last place of care.
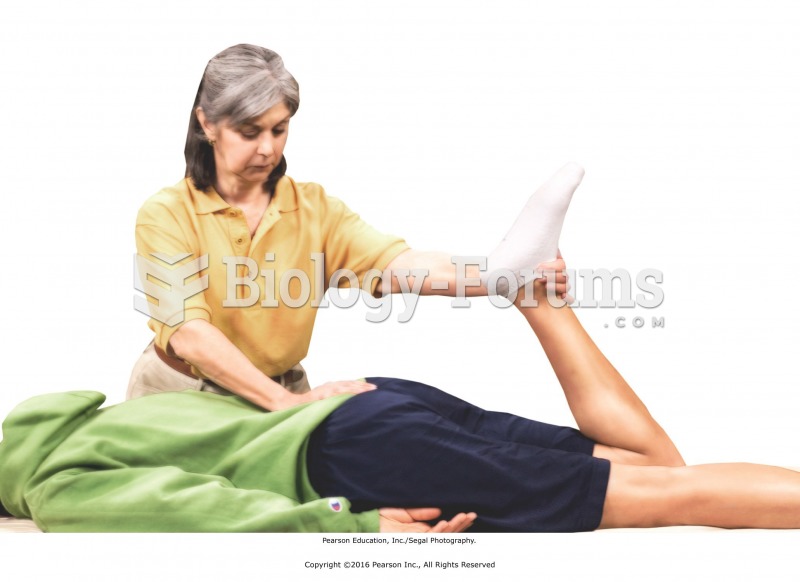 Massage is routinely incorporated into the rehabilitation of musculoskeletal injuries.
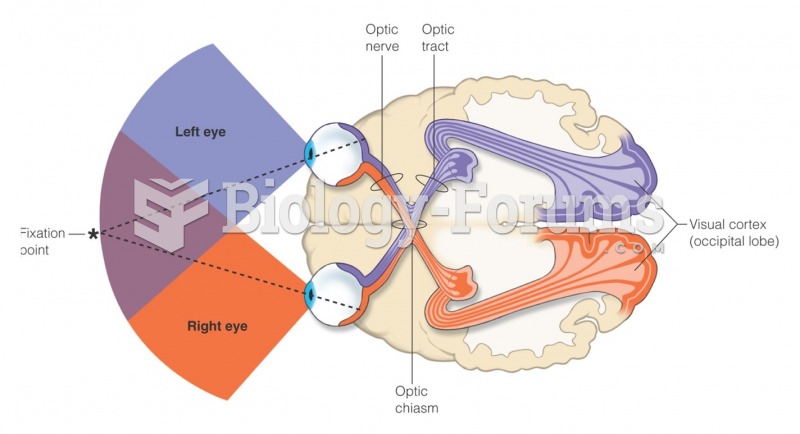 Visual fields of the eye and the visual pathway to the brain
 Mutations in cis-regulatory elements of Ultrabithorax cause homeotic transformations