This topic contains a solution. Click here to go to the answer
|
|
|

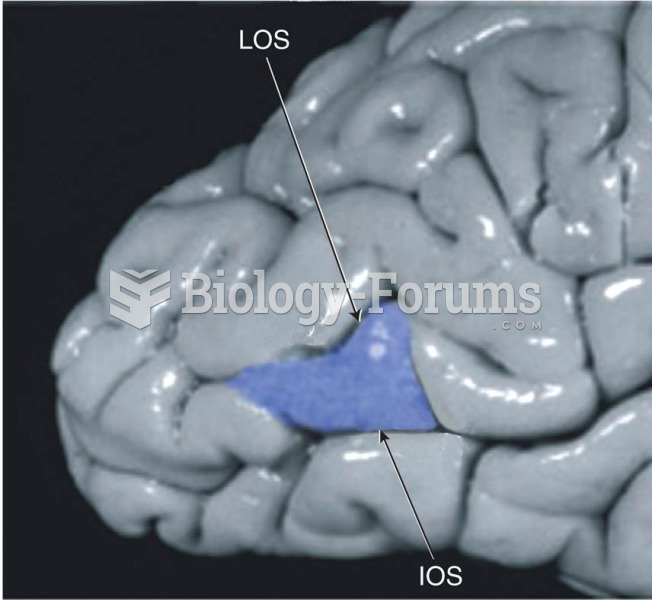 The Location of Visual Area V5
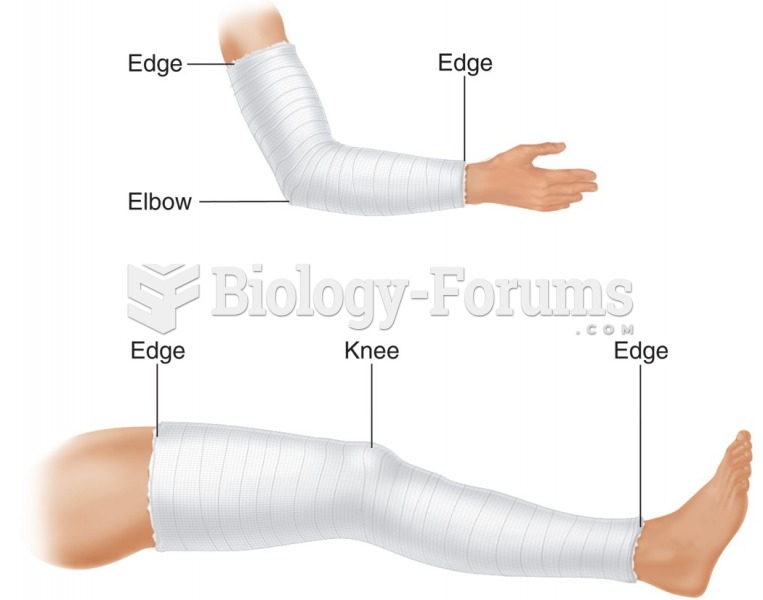 Check the edges of a cast and report any changes.
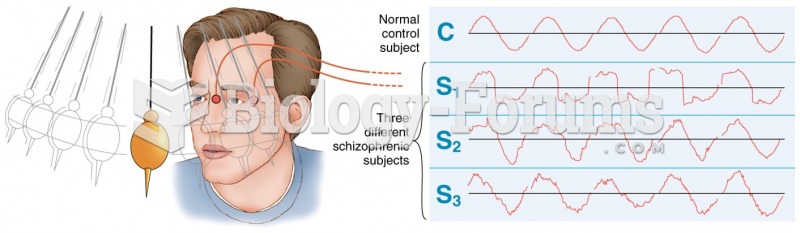 Visual tracking of a pendulum by a normal control subject (top) and three schizophrenics. (Adapted ...
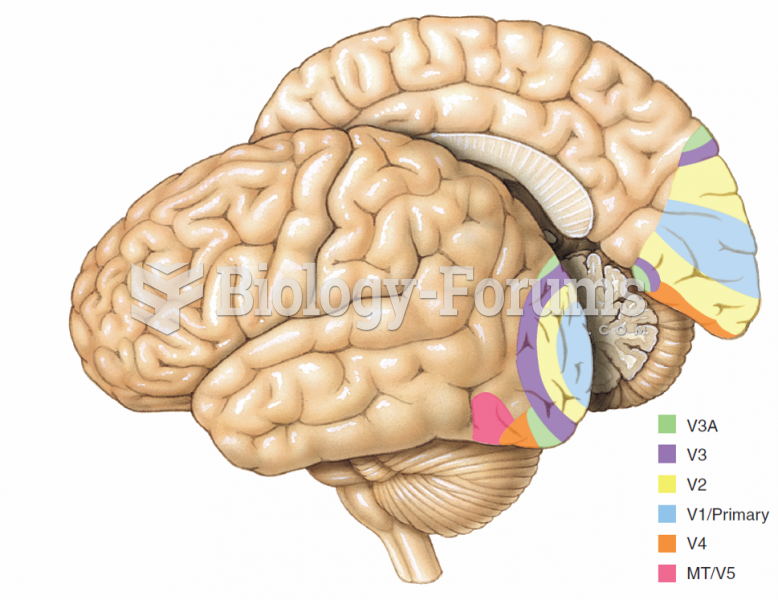 Some of the visual areas that have been identified in the human brain.
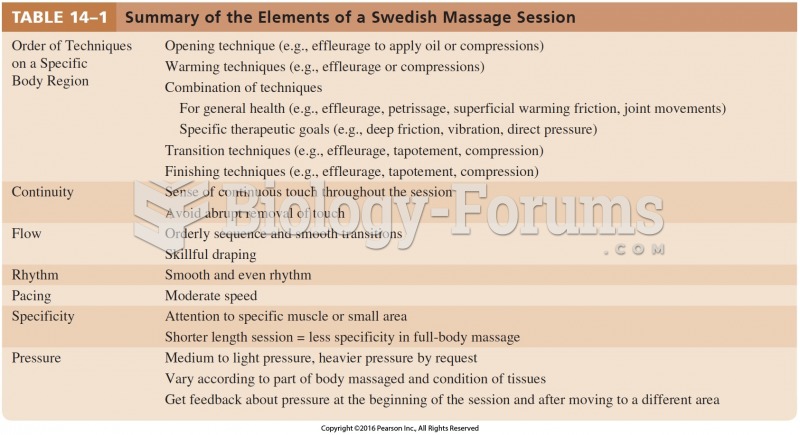 Summary of the Elements of a Swedish Massage Session Cont.
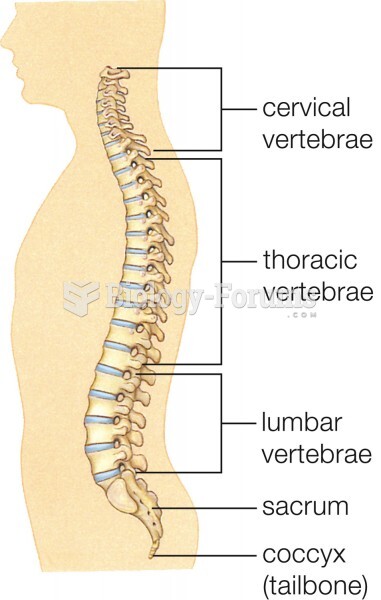 Major bone (tan) and cartilage (light blue) elements of the human skeleton. Inset shows regions of v