This topic contains a solution. Click here to go to the answer
|
|
|

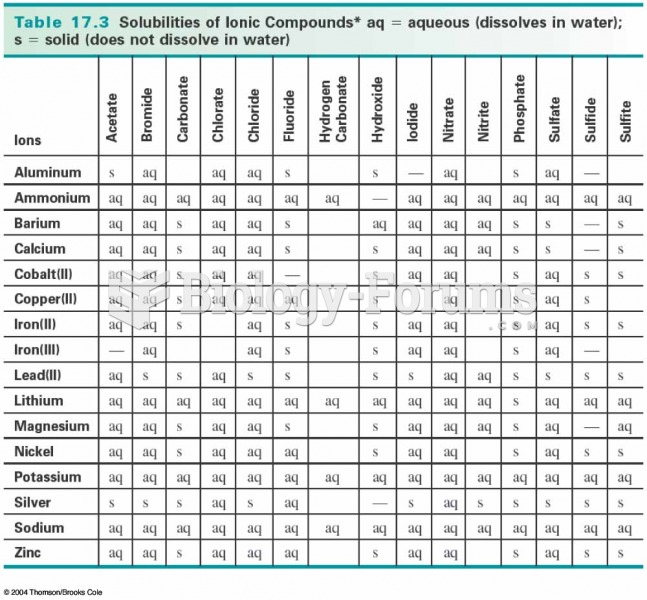 Solubility Chart
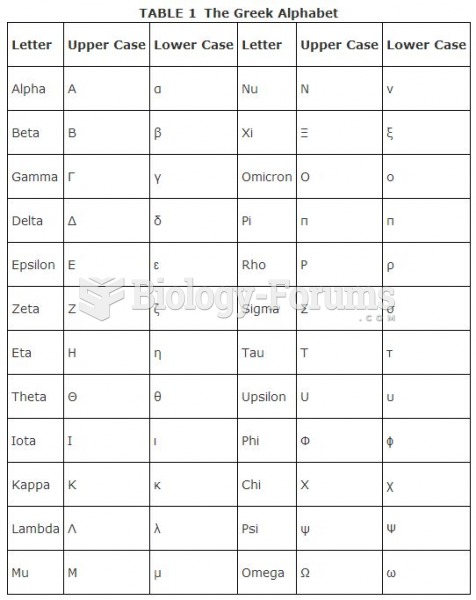 Greek Alphabet Chart
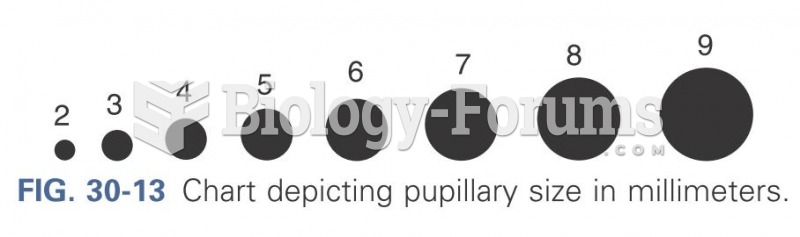 Chart depicting pupillary size in millimeters
 All messages must be documented and placed in the patient's chart.
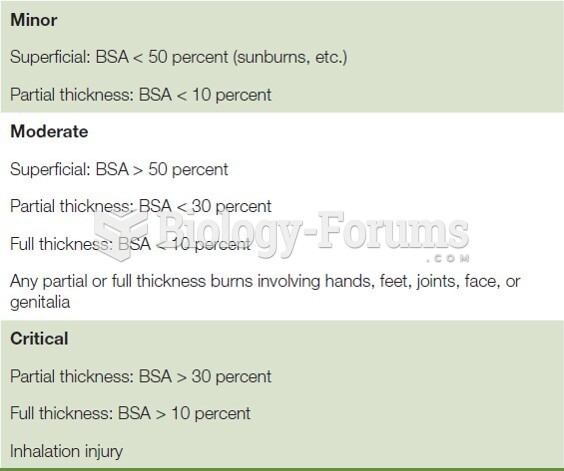 Burn Severity Chart
 A truncated cell lineage chart for C. elegans