This topic contains a solution. Click here to go to the answer
|
|
|

 Threat display by a Sydney funnel-web spider (Atrax robustus).
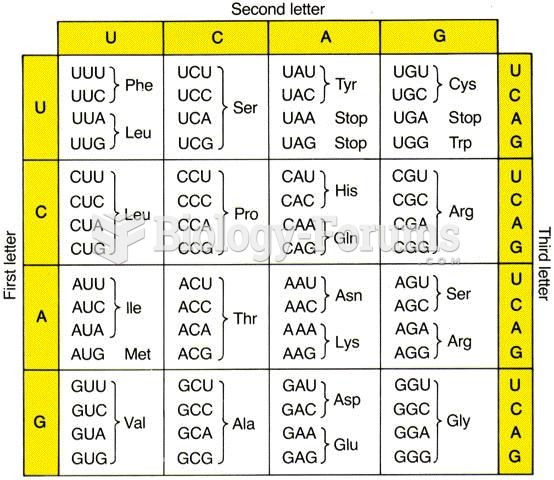 Codon Chart
 Display Used by Murray, Boyaci, and Kersten (2006)
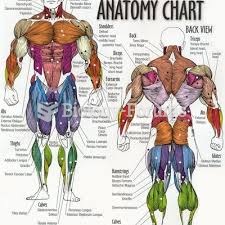 Anatomy Chart
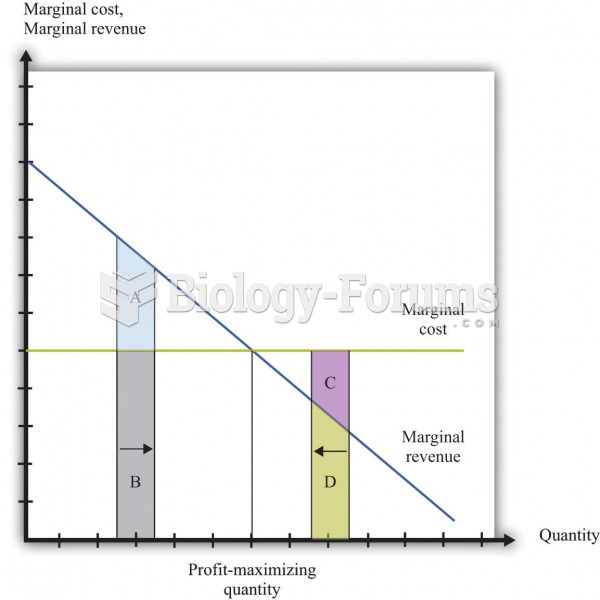 Profit-maximizing Chart
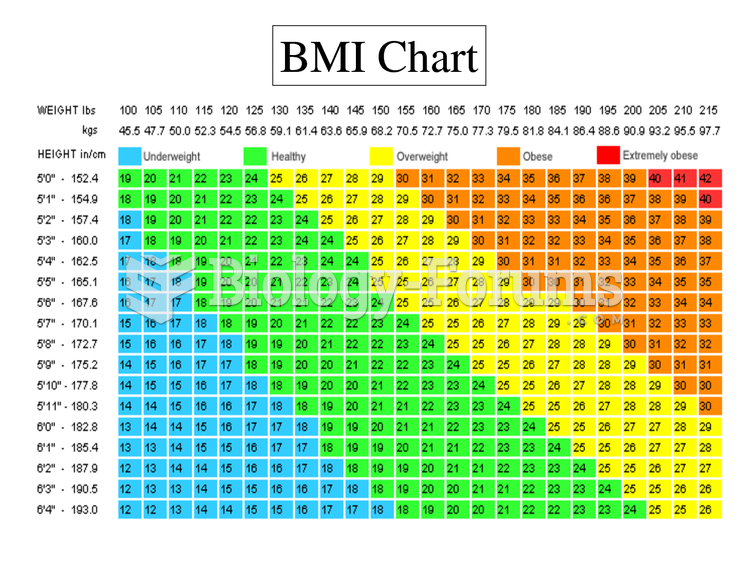 BMI Chart Weight Chart