|
|
|
Stevens-Johnson syndrome and Toxic Epidermal Necrolysis syndrome are life-threatening reactions that can result in death. Complications include permanent blindness, dry-eye syndrome, lung damage, photophobia, asthma, chronic obstructive pulmonary disease, permanent loss of nail beds, scarring of mucous membranes, arthritis, and chronic fatigue syndrome. Many patients' pores scar shut, causing them to retain heat.
According to the National Institute of Environmental Health Sciences, lung disease is the third leading killer in the United States, responsible for one in seven deaths. It is the leading cause of death among infants under the age of one year.
When taking monoamine oxidase inhibitors, people should avoid a variety of foods, which include alcoholic beverages, bean curd, broad (fava) bean pods, cheese, fish, ginseng, protein extracts, meat, sauerkraut, shrimp paste, soups, and yeast.
Despite claims by manufacturers, the supplement known as Ginkgo biloba was shown in a study of more than 3,000 participants to be ineffective in reducing development of dementia and Alzheimer’s disease in older people.
Your skin wrinkles if you stay in the bathtub a long time because the outermost layer of skin (which consists of dead keratin) swells when it absorbs water. It is tightly attached to the skin below it, so it compensates for the increased area by wrinkling. This happens to the hands and feet because they have the thickest layer of dead keratin cells.
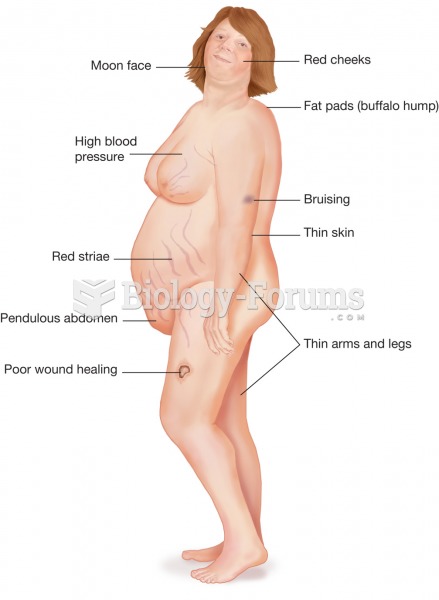
 Cushing syndrome. This syndrome includes the symptoms of obesity, moon face, hyperglycemia, and musc
 Electrocardiography. (a) Electrodes are placed on the patient’s chest to record the electrical event


