An oral report that includes a graphical presentation should be used
a. as often as possible as it is the best method.
b. to interpret results.
c. to vividly present the research findings.
d. only if graphs serve the purpose better than text or tables.
e. All of these apply to oral reports with graphical presentations.
Question 2
What does the Pareto curve indicate with regard to usability testing?
a. Even testing hundreds of users is unlikely to uncover all of a site's usability problems.
b. All of a site's usability problems can be identified by testing a small number of users.
c. Usability testing is effective but prohibitively costly.
d. Usability testing can be successfully completed in just a month.

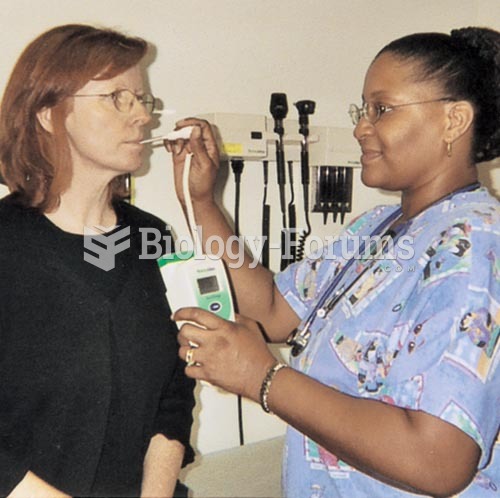 Taking a Patient’s Oral Temperature with an Electronic Thermometer
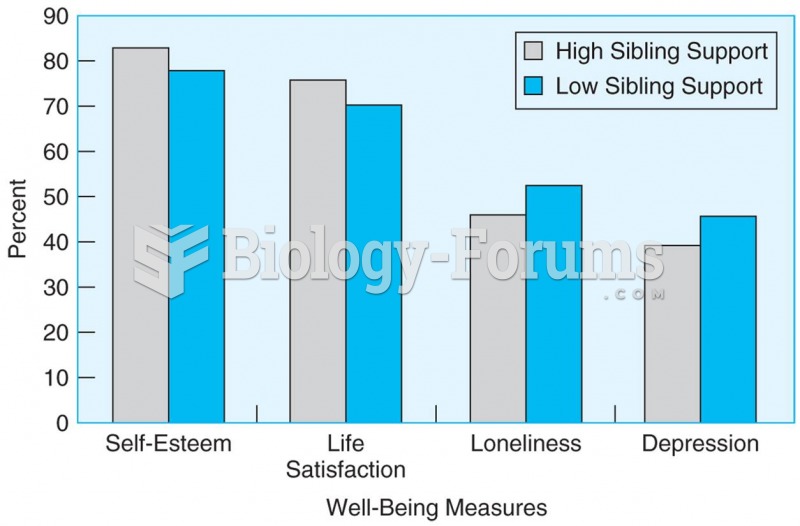 Young adults with low levels of parental support report significantly better scores on measures of ...
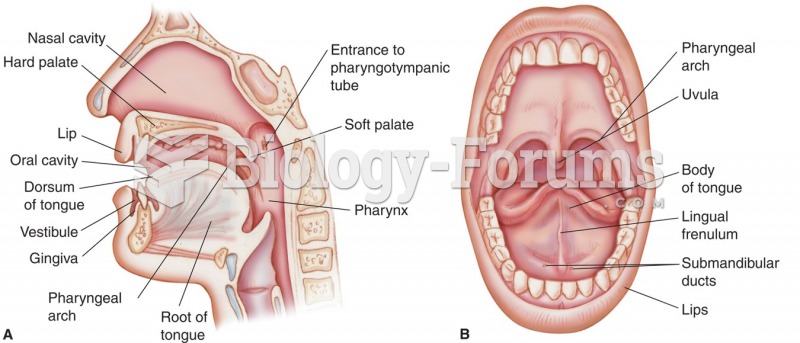 The oral cavity: (A) sagittal section; (B) anterior view as seen through the open mouth.
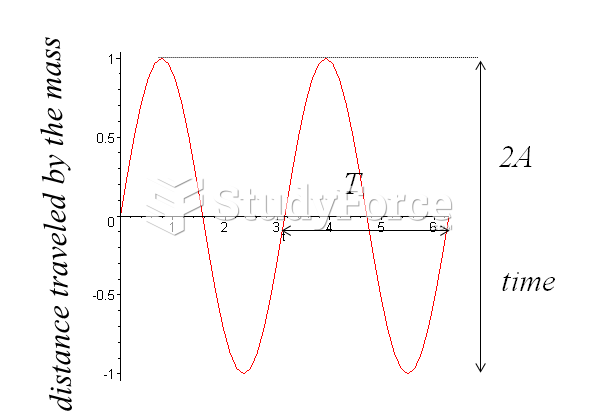 Graphical Representation of SHM
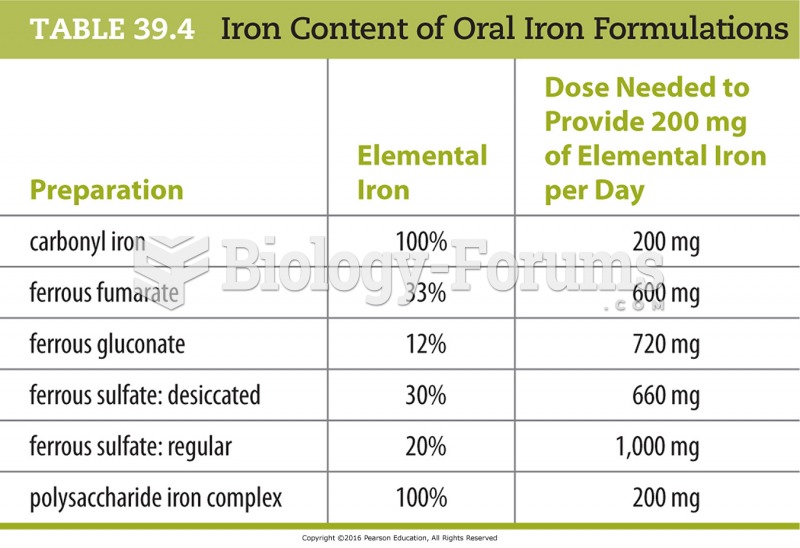 Iron Content of Oral Iron Formulations
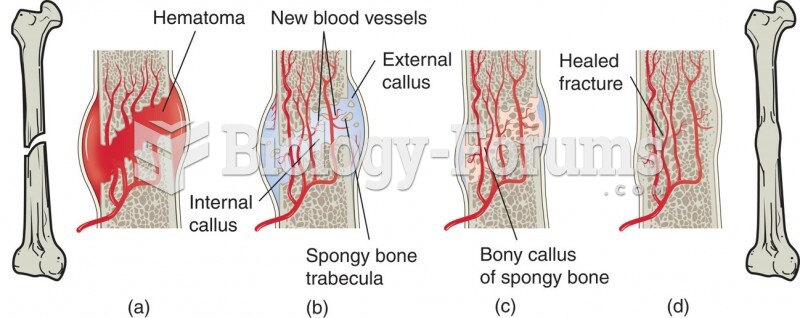 Bone Healing. The Bone Repair Cycle. Presentation of a Forearm Fracture