Graphically, economic growth is represented as
A) a movement along the production possibilities curve.
B) a movement from a point inside the production possibilities curve to a point on the curve itself.
C) an inward shift of the production possibilities curve.
D) an outward shift of the production possibilities curve.
Question 2
A model is used to explain economic behavior. Therefore
A) the assumptions must be complex while the model itself is simple.
B) the model must be complex.
C) the model must be simple.
D) the model can be either simple or complex so long as it explains economic behavior.

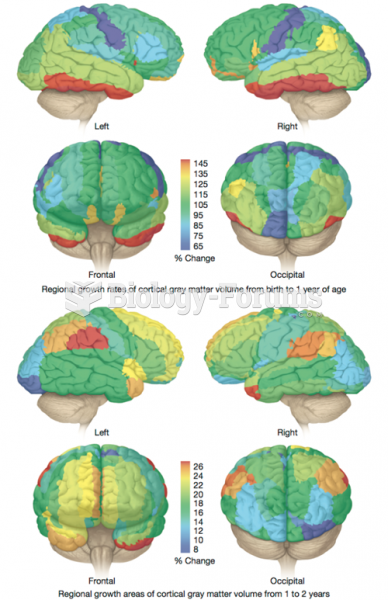 Rate of Growth of Brain Areas
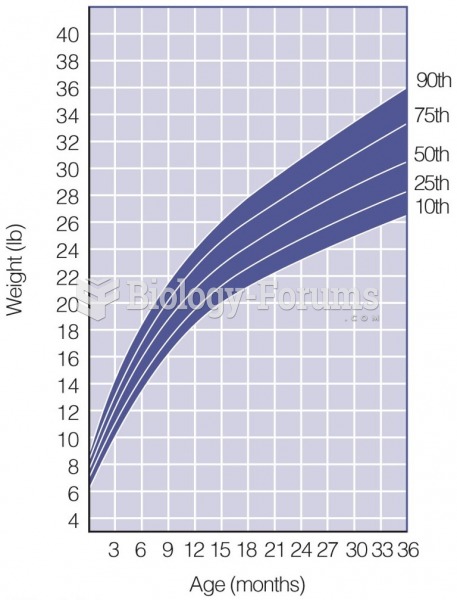 Growth Chart
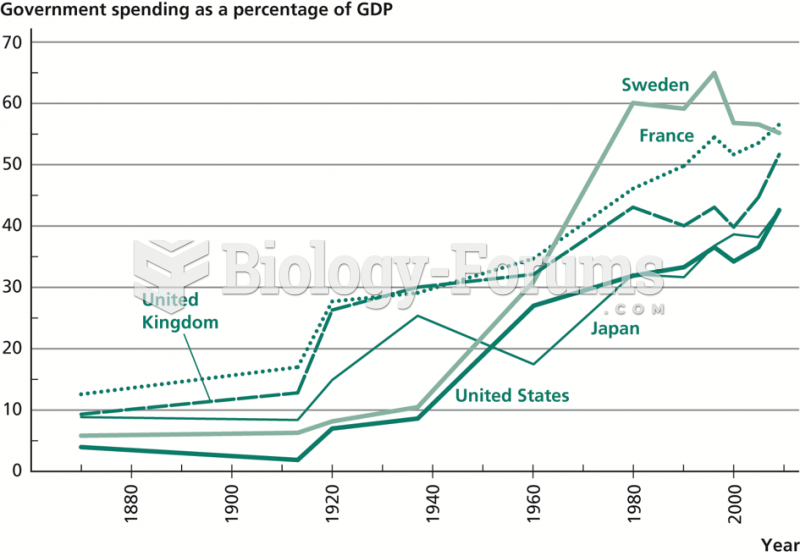 Growth of Government Spending, 1870–2009
 economic
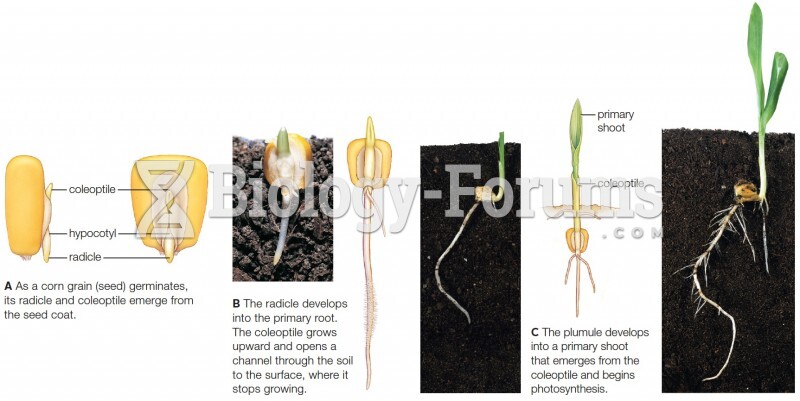 Early growth of corn (Zea mays), a typical monocot.
 Mechanisms involved in production of metabolic alkalosis due to loss of gastric fluid